Wednesday, June 23, 2021

Ramssol Group Berhad

Copyright@http://lchipo.blogspot.com/
Follow us on facebook: https://www.facebook.com/LCH-Trading-Signal-103388431222067/

Open to apply: 22/06/2021
Close to apply: 29/06/2021
Balloting: 02/07/2021
Listing date: 13/07/2021

Share Capital
Market Cap: RM100.373 mil
Total Shares: 223.0515 mil shares
Industry (Net Profit %)
Employee engagement platforms market, 2017-2020: CAGR 14.69%

Competitors compare (Profit before tax margin%)
Accenture PLC: PE33.8
Capgemini SE: PE28
HCL Technologies Limited: PE21.13
Infosys Limited: PE33
International Business Machines Corporation: PE24
Tech Mahindra Limited: PE21
Wipro Limited:PE28

Business
1. HCM: Human Capital Management (Consulting and implementation, Sale of software licences, Technical support and maintenance services).
2. IT staff augmentation services
3. HCM technology applications
Malaysia: 45.53%
Singapore: 11.37%
Thailand: 29.82%
Indonesia: 13.07%
Others: 0.21%

Fundamental
1.Market: Ace Market
2.Price: RM0.45 (EPS:RM0.034)
3.P/E: PE13.24
4.ROE(Pro Forma III): 32.22%
5.ROE: 103%(2020), -%(2019), 16.16%(2018), 2.95%(2017)
6.Cash & fixed deposit after IPO: 0.0509
7.NA after IPO: RM0.10
8.Total debt to current asset after IPO: 0.288 (Debt:6.922mil, Non-Current Asset: 4.594mil, Current asset: 24.049mil)
9.Dividend policy: No fixed dividend policy. 

Past Financial Performance (Revenue, Earning Per shares, PAT%)
2020: RM25.331 mil (Eps: 0.0340),PAT%: 29.74%
2019: RM15.439 mil (Eps: 0.0200),PAT%: 29.11%
2018: RM12.549 mil (Eps: 0.0007),PAT%: 1.41%
2017: RM6.808 mil (Eps: 0.0004),PAT%: 1.29%
*EPS 2020 & 2019 prospecture book pg234 might not correct. 

After IPO Sharesholding (Director)
Dato’ CM Vignaesvaran A/L Jeyandran: 0.11%
Tan Chee Seng: 33.26%
Lee Miew Lan: 17.84%
Liew Yu Hoe: 1.63%
Goh Keng Tat: 0.11%
Sim Seng Loong @ Tai Seng: 0.11%

Directors & Key Management Remuneration for FYE2021 (from gross profit 2020)
Total director remuneration: RM2.125 mil
key management remuneration: RM0.3 mil- 0.35mil
total (max): RM2.475 mil or 16.13%  

Use of fund
Business expansion into Philippines: 9.98%
Expansion of Feet’s and Lark in Southeast Asia: 25.30% 
R&D Research: 16.34%
Working capital: 30.13%
Listing expenses: 18.25%

Highlight
1. Expansion business into Philippines.
2. Expansion of Feet’s and Lark in Southeast Asia
3. Have successful experience in Msia, S'pore, Thailand & Indonesia. 

Good thing is:
1. PE13.24 is accepetable. 
2. Revenue from multiple country. 
3. IPO fund 81.75% use for business expansion.
4. Revenue is increase over the 4 years. 

The bad things:
1. ROE is not stable (ROE unable to use for estimationd). 
2. Trade receivable sudently increase to RM11.805mil in 2020 (not overdue yet).
3. 18.25% IPO fund use for listing expenses is over average lisiting expenses percentage.
4. Directors & top management remuneration is over 16% from the gross profit. 

Conclusions (Blogger is not wrote any recommendation & suggestion. All is personal opinion and reader should take their own risk in investment decision)
This is a IPO company that seek for expansion. Reader have to aware on the unable of the ROE, & have to hold it for aim for growth. It consider high risk and also come with high return potential category come company. This is not a dividend / passive income generated company for investor at this moment. For more on risk vs business expand ratio can refer to below chart. 

*Valuation is only personal opinion & view. Perception & forecast will change if any new quarter result release. Reader take their own risk & should do own homework to follow up every quarter result to adjust forecast of fundamental value of the company.

Yenher Holdings Berhad


Copyright@http://lchipo.blogspot.com/
Follow us on facebook: https://www.facebook.com/LCH-Trading-Signal-103388431222067/

Open to apply: 22/06/2021
Close to apply: 01/07/2021
Balloting: 05/07/2021
Listing date: 15/07/2021

Share Capital
Market Cap: RM177.384mil
Total Shares: 300mil shares

Industry (Net Profit %)
Production Value of Livestock in Malaysia (CAGR): 6.6%
Growth Forecast for the Animal Health and Nutrition Industry (CAGR 2021-25): 4.3%

Competitors compare (Profit before tax margin%)
Yenher: 14.6% (PE12.72)
Peterlabs: 6.8% (PE20.36)
AsiaVet: loss making
RhoneMa: 7.9% (PE17.16)
Danberg: 12%
Ritamix: 10.9% (PE23.49)
Sunzen: loss making

Business
Manufacturing and distribution of animal health and nutrition products.
Distribution: 44.26%
Manufacturing: 55.74%
Local market: 89.77%
Overseas market: 10.23%

Fundamental
1.Market: Main Market
2.Price: RM0.95 (EPS:RM0.0747)
3.P/E: PE12.72
4.ROE(Pro Forma III): 12.70%
5.ROE: 19.39%(2020), 18.73%(2019), 31.30%(2018), 22.09%(2017)
6.Cash & fixed deposit after IPO: 0.2144
7.NA after IPO: RM0.59
8.Total debt to current asset after IPO: 0.16 (Debt: 25.452mil, Non-Current Asset: 46.345mil, Current asset: 155.502mil)
9.Dividend policy: 40% PAT dividend policy. 

Past Financial Performance (Revenue, Earning Per shares, PAT%)
2020: RM202.635 mil (Eps: 0.0951),PAT%: 10.73%
2019: RM179.061 mil (Eps: 0.0838),PAT%: 15.07%
2018: RM181.109 mil (Eps: 0.1158),PAT%: 11.03%
2017: RM177.380 mil (Eps: 0.0808),PAT%: 11.05%

After IPO Sharesholding
CGH Holding: 45%
-Cheng Moon Tat: 7.5% direct, indirect 45%
-Cheng Mooh Kheng: 3.5% direct, indirect 45%
-Cheng Mooh Chye: 3.5% direct, indirect 45%

Directors & Key Management Remuneration for FYE2021 (from gross profit 2020)
Total director remuneration: RM7.483
key management remuneration: RM0.70mil-0.95mil
total (max): RM8.433mil or 16.09%  

Use of fund
Construction of new GMP-Compliant Manufacturing Plant: 50.64%
Purchase of new machinery & equipment: 15.85%
Working capital: 27.30%
Listing expenses: 6.21%

Highlight
1. Current manufacturing production utilisation rate at 100%. 
2. New Manufacturing plant increase produce
-Complete feed & formulated product: 353.75% (573 to 2600 tones)
-Biotech animal feed ingredients: 422.65% (287 to 1,500 tones)
3. New Manufacturing plant to be completed build fourth quarter of 2023.
4.  Expand to more oversea market.

Good thing is:
1. PE12.72 below average competitor PE. 
2. Debt is not high. 
3. Have fixed dividend policy. 
4. Revenue increase of 4 years.
5. Almost all IPO fund use to expand business. 
6. by 2023 production increase 300%-400%

The bad things:
1. Nett profit around 10%. 
2. Industry growing CAGR is low 4.3%
3. Director & top management remuneration taking aways 16.09% gross revenue. 
4. Three main director age above 52.

Conclusions (Blogger is not wrote any recommendation & suggestion. All is personal opinion and reader should take their own risk in investment decision)
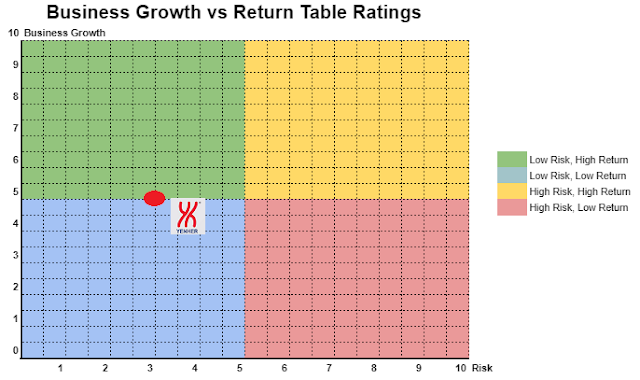
Is a little bit discounted IPO. With the new manafucturing facilites (to be completed by 2023), we should able to see better  revenue grow in business. Business grwoth & risk refer to below chart.  

*Valuation is only personal opinion & view. Perception & forecast will change if any new quarter result release. Reader take their own risk & should do own homework to follow up every quarter result to adjust forecast of fundamental value of the company.

Tuesday, June 8, 2021

Nestcon Berhad


Copyright@http://lchipo.blogspot.com/
Follow us on facebook: https://www.facebook.com/LCH-Trading-Signal-103388431222067/

Open to apply: 08/06/2021
Close to apply: 17/06/2021
Balloting: 21/06/2021
Listing date: 29/06/2021

Share Capital
Market Cap: RM180.270mil
Total Shares: 643.822mil shares

Industry (Net Profit %)
Growth forecast Construction Industry CAGR: 7.3%
Growth forecast Real Estate Construction market CAGR: 5.1%
Growth forecast Civil Englineering & Specialised CAGR: 9.1%

Competitors compare (Net profit margin%)
Nestron: 5.6% (PE12.61)
GDB: 9.3% (PE19.88)
Inta Bina: 4.6% (PE15.92)
MGB:2.8% (PE20.97)
Pesona Metro: 2.8% (loss making)
TCS: 10.7% (PE12.87)

Business
Building segment: 57.9% (residential, commercial, industrial & other)
Civil engineering & infra: 42.1% (earthworks, roadworks, drainage & other)

Fundamental
1.Market: Ace Market
2.Price: RM0.28 (EPS:RM0.0222)
3.P/E: PE12.61
4.ROE(Pro Forma III): 12.58%
5.ROE: 19.80%(2020), 27.21%(2019), 23.93%(2018), 17.75%(2017)
6.Cash & fixed deposit after IPO: 0.15
7.NA after IPO: RM0.18
8.Total debt to current asset after IPO: 1.02 (Debt: 253.785mil, Non-Current Asset: 120.584mil, Current asset: 246.884mil)
9.Dividend policy: Does not have any formal dividend policy. 

Past Financial Performance (Revenue, Earning Per shares)
2020: RM344.479 mil (Eps: 0.0222)
2019: RM422.786 mil (Eps: 0.0227)
2018: RM217.764 mil (Eps: 0.0116)
2017: RM190.857 mil (Eps: 0.0085)

Order book
To be billed next 1-3 years: RM1.212 bil.
Net Profit Margin
2020: 4.2%
2019: 3.7%
2018: 4.5%
2017: 3.1%

After IPO Sharesholding
Mohd Noor Bin Setapa: 0.1%
Datuk Ir.Dr.Lim: 60%
Ong Yong Chuan: 10%
Lim Joo Seng: 0.3%
Nor Azzam bin Abdul Jalil: 0.1%
Yeoh Sheong Lee: 0.1%

Directors & Key Management Remuneration for FYE2021 (from gross profit 2020)
Total director remuneration: RM1.861 mil or 5.59%
key management remuneration: RM1.05 mil - 1.3mil or 3.15%-3.91%
total (max): RM3.161 mil or 9.50%  

Use of fund
Establish IBS facilitiy: 13.3%
Acquire machineries & equipment: 14.7%
Upgrade software and system: 2.2%
Repayment bank borrowings: 36.6%
Working capital: 24.3%
Listing expenses: 8.9%

Good thing is:
1. IPO price at average PE, not consider expensive.  
2. ROE have over 10%
3. Having enought order to sustain next 3 year revenue. 
4. IPO in low PE environment time.

The bad things:
1. Having low net profit after tax (less than 5%)
2. Did not have dividend formal policy.
3. Debt ratio is a bit high. 
4. Use 36.6% IPO fund to pay debt. 

Conclusions (Blogger is not wrote any recommendation & suggestion. All is personal opinion and reader should take their own risk in investment decision)
Is a normal IPO. Able to get other competitor that have better performance compare to this company. 

*Valuation is only personal opinion & view. Perception & forecast will change if any new quarter result release. Reader take their own risk & should do own homework to follow up every quarter result to adjust forecast of fundamental value of the company.
Saturday, June 5, 2021

Pekat Group Berhad


Copyright@http://lchipo.blogspot.com/
Follow us on facebook: https://www.facebook.com/LCH-Trading-Signal-103388431222067/

Open to apply: 02/06/2021
Close to apply: 10/06/2021
Balloting: 14/06/2021
Listing date: 23/06/2021

Share Capital
Market Cap: RM206.389mil
Total Shares: 644.968mil shares (Public apply: 32.248mil, Company Insider/Miti/Private Placement/other: 138.667mil)

Industry
Solar PV Installation CAGR: 50.3% (2015-2019)
Solar PV Module price: CAGR -21.1% (RM/W)
Competitors (PE)
Solarevst: 52.63 
Samaiden: 60.4

Business
1.Solar Division: Design, Supply & Installation of solar PV system and power plants.
2.ELP division: Supply and installation of ELP System.
3.Trading Division: Distribution of electrical products and accessories.

Fundamental

1.Market: Ace Market
2.Price: RM0.32 (EPS:RM0.021)
3.P/E: PE15.2
4.ROE(Pro Forma III): 13%
5.ROE: 21.3%(2020), 31.2%(2019), 29.5%(2018), 36.6%(2017)
6.Cash & fixed deposit after IPO: RM0.0586 per shares
7.NA after IPO: RM0.16
8.Total debt to current asset after IPO: 0.446 (Debt: 50.937mil, Non-Current Asset: 41.109mil, Current asset: 114.178mil)
9.Dividend policy: no formal dividend policy. 

Past Financial Performance (Revenue, Earning Per shares)
2020: RM125.562 mil (Eps: 0.0210)
2019: RM119.521 mil (Eps: 0.0230)
2018: RM120.129 mil (Eps: 0.0170)
2017: RM72.830 mil (Eps: 0.0150)

Net Profit Margin
2020: 10.8%
2019: 12.4%
2018: 9.2%
2017: 13.0%

Order book
2021: RM117.2 mil
2022: RM24.8 mil
2023: RM11.5 mil

After IPO Sharesholding

Chin Soo Mau: 34.9%
Tai Yee Chee: 10.4%
Wee Chek Aik: 8.6%
Hextar (Stock code 5151): 19.6%

Directors & Key Management Remuneration for FYE2021 (from gross profit 2020)
Total director remuneration: RM2.548 mil or 6.68%
key management remuneration: RM0.90 mil - 1.05mil or 2.36%- 2.75%
total (max): RM3.598 mil or 9.4%  

Use of fund
Contrusction of new head office and operation facilities: 40.6%
Working capital: 28.6%
Repayment of bank borrowings: 22.5%
Listing expenses: 8.3%

Good thing is:

1. PE15 is a fair value. 
2. Sunrise industry (clean energy demand increase, lower solar PV module price). 
3. Competitor from same industry with high PE (over 50). 
4. Revenue increase over 4 years.

The bad things:
1. Use 22.5% of IPO fund to pay debt.  
2. Drop in ROE%
3. No formal dividend policy. 
4. Director & management remuneration near to 10%. 

Conclusions (Blogger is not wrote any recommendation & suggestion. All is personal opinion and reader should take their own risk in investment decision)
Consider a an attractive IPO. The offer price of IPO RM0.32 (PE15) much lower compare to same industry competitor. Overall business activities is on sunrise industry & the industry expected to continue growth globally.  
*Valuation is only personal opinion & view. Perception & forecast will change if any new quarter result release. Reader take their own risk & should do own homework to follow up every quarter result to adjust forecast of fundamental value of the company.