Wednesday, April 24, 2024

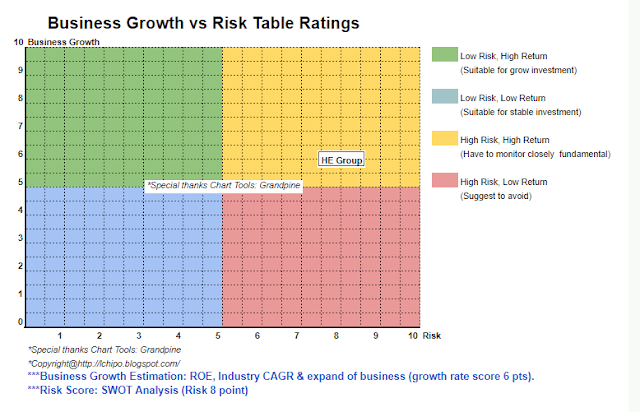
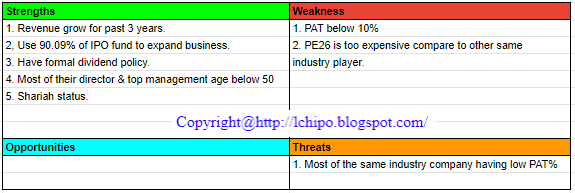
FARM PRICE HOLDINGS BERHAD

Copyright@http://lchipo.blogspot.com/

Follow us on facebook: https://www.facebook.com/LCH-Trading-Signal-103388431222067/

***Important***Blogger is not wrote any recommendation & suggestion. All is personal
opinion and reader should take their own risk in investment decision.
Open to apply: 24 Apr 2024 
Close to apply: 30 Apr 2024
Balloting: 03 May 2024
Listing date: 14 May 2024

Share Capital 
Market cap: RM108 mil
Total Shares: 450 mil shares

Industry CARG 
Malaysia’s consumption of fresh vegetables 2018-2022: 12.5%
Malaysia’s monthly household expenditure of vegetables 2016-2022: 1.2% 
Singapore’s supply of fresh vegetables 2018-2022: -4.7% 
Industry competitors comparison (net profit%)
1. Farm Price: 7.6%
2. Lian Hoe Huat Enterprise (M) S/B: 5.4%
3. Keongco Malaysia S/B: 4.2%
4. YFC Trading (M) S/B: 2.2%
5. Others: 0.5% to 1.7%

Business (FYE 2023) 
Wholesales distribution of fresh vegetable and F&B products, groceries, retailing. 
Business revenue by segment
1. Fresh vegetables: 77.61%
2. F&B product and other groceries: 16.01%
3. Retailling Segment: 6.38%
Revenue by Geo
1. Malaysia: 74.54%
2. Singapore: 25.46%

Fundamental  
1.Market: Ace Market
2.Price: RM0.24
3.Forecast P/E: 12.44
4.ROE(Pro forma III):  18.47
5.ROE: 29.86%(FPE2022), 28.04%(FYE2021), 35.83%(FYE2020)
6.Net asset: 0.14
7.Total debt to current asset: 0.524 (Debt: 23.763mil, Non-Current Asset: 25.544mil, Current asset: 45.344mil)
8.Dividend policy: doesn’ have formal dividend policy.
9. Shariah status: Yes

Past Financial Performance (Revenue, Earning Per shares, PAT%) 
2024 (FYE 31Dec): RM114.199 mil (Eps: 0.0193), PAT: 7.62%
2022 (FYE 31Dec): RM94.376 mil (Eps: 0.0106), PAT: 5.03%
2021 (FYE 31Dec): RM81.966 mil (Eps: 0.0069), PAT: 3.80%
2020 (FYE 31Dec): RM73.540 mil (Eps: 0.0064), PAT: 3.89%

Major customer (2023) 
1.TF vegetable: 5.42%
2.LTE Vegetable: 4.03%
3.Compass: 3.94%
4.Farm direct 4u (S) Pte Ltd: 3.79%
5.Nyuk Sheng Plantation Sdn Bhd: 2.86%
***total 20.04%

Major Sharesholders 
1.Dr. Tiong Lee Chian: 62.58% (indirect)
2.Liew Tsuey Er: 67.42% (indirect)
3.TLC Consolidation: 60% (direct)

Directors & Key Management Remuneration for FYE2023  
(from Revenue & other income 2022)
Total director remuneration: RM1.034 mil
key management remuneration: RM0.30 mil – RM0.50 mil
total (max): RM1.534 mil or 6.65%

Use of funds 
1.Construction of new facilities on Lot 55359: 26.41%
2.Purchase of machinery, equipment and logistics fleet: 8.17%
3.Planned regional distribution and procurement centre: 6.54%
4.Working capital: 43.22%
5.Estimated listing expenses: 15.93%


Conclusions (Blogger is not wrote any recommendation & suggestion. All is personal opinion and reader should take their own risk in investment decision)
Overall is low PAT% business. The weakness of this type of business is, with a small increase of cost will cause the company QR to report losses, hence will effect shares price heavily.  

*Valuation is only personal opinion & view. Perception & forecast will change if any new quarter result release. Reader take their own risk & should do own homework to follow up every quarter result to adjust forecast of fundamental value of the company.


Wednesday, April 17, 2024

SIN-KUNG LOGISTICS BERHAD

Copyright@http://lchipo.blogspot.com/
Follow us on facebook: https://www.facebook.com/LCH-Trading-Signal-103388431222067/

***Important***Blogger is not wrote any recommendation & suggestion. All is personal
opinion and reader should take their own risk in investment decision.
Open to apply: 18 Apr 2024 
Close to apply: 02 May 2024
Balloting: 06 May 2024
Listing date: 15 May 2024

Share Capital 
Market cap: RM156 mil
Total Shares: 1.2 bil shares

Industry CARG
(***based on manual calculated CARG in percentage, actual figure might differ)
Total air cargo handled (Malaysia), 2018 – 2023: -0.6264%
Total container throughput (Malaysia), 2018 – 2023: 3.084%
External trade (Malaysia), 2018 – 2023: 7.026%
GDP from manufacturing sector (Malaysia), 2018 – 2023: 3.7643%
Industry competitors comparison (net profit%)
1. Sin-Kung Group: 12.33%
2. MasKargo Logistics Sdn Bhd: 8.5%
3. Transocean Holdings Bhd: 6.09%  (PE254.48)
4. Harbour-Link Group Bhd: 17.39% (PE3.78)
5. Tri-Mode System (M) Berhad: 8.4% (PE15.43)
6. Swift Haulage Berhad: 7.65% (PE9.28)
7. Others: -13.28% to 5.78% 

Business (FYE 2023) 
Integrated logistics service provider principally involved in the provision of trucking services with a focus on airport-to-airport road feeder services. 
Revenue by segments
1. Trucking services (airport-to-airport road feeder services): 52%
2. Trucking services (Point-to-trucking services): 20.3%
3. Container haulage services: 9.5%
4. Warehousing and distribution services: 15.7%
5. Other logistic-related services: 2.5%
Revenue by Goe
1. Malaysia: 54.1%
2. Singapore: 27.3%
3. Others countries: 18.6%

Fundamental 
1.Market: Ace Market
2.Price: RM0.13
3.Forecast P/E: 26 (FYE2023, EPS RM0.005)
4.ROE(Pro forma III): 7.64%
5.ROE: 22.91%(FPE2022), 34.64%(FYE2021), 33.87%(FYE2020)
6.Net asset: 0.01
7.Total debt to current asset: 4.298 (Debt: 126.525mil, Non-Current Asset: 180.905mil, Current asset: 29.435mil)
8.Dividend policy: no formal dividend policy.
9. Shariah status: Yes

Past Financial Performance (Revenue, Earning Per shares, PAT%) 
2023 (FYE 31Dec): RM51.984 mil (Eps: 0.0050), PAT: 12.3%
2022 (FYE 31Dec): RM56.743 mil (Eps: 0.0100), PAT: 21.8%
2021 (FYE 31Dec): RM52.256 mil (Eps: 0.0120),PAT: 27.8%
2020 (FYE 31Dec): RM43.071 mil (Eps: 0.0080),PAT: 21.8%

Major customer (2023) 
1. Customer A: 16.9%
2. Customer C: 12.7%
3. Customer F: 9.8%
4. Customer D: 5.8%
5. Customer G: 5.8%
***total 51.0%

Major Sharesholders 
1. Lille Management: 29.8% (direct)
2. Alan Ong Lay Wooi: 29.8% (direct)
3. Angelina Ong Lay Shee: 14.9% (direct)
4. Adeline Ong Lay Suen: 29.8% (indirect)
5. Ameline Ong Lay Ling: 29.8% (indirect)
6. Alex Ong Lay Ming: 29.8% (indirect)

Directors & Key Management Remuneration for FYE2024 

(from Revenue & other income 2023)
Total director remuneration: RM2.061 mil
key management remuneration: RM0.90 mil – RM1.10 mil
total (max): RM3.161 mil or 13.15%

Use of funds 
1. Expansion of warehouse & distribution services: 38.6%
2. Repayment of bank borrowings: 37%
3. Purchase of commercial vehicles: 7.7%
4. Working capital: 4.0%
5. Estimated listing expenses: 12.7%
Conclusions (Blogger is not wrote any recommendation & suggestion. All is personal opinion and reader should take their own risk in investment decision)
Overall is high risk investment.

*Valuation is only personal opinion & view. Perception & forecast will change if any new quarter result release. Reader take their own risk & should do own homework to follow up every quarter result to adjust forecast of fundamental value of the company.

Friday, March 29, 2024

MKH OIL PALM (EAST KALIMANTAN) BERHAD

Copyright@http://lchipo.blogspot.com/
Follow us on facebook: https://www.facebook.com/LCH-Trading-Signal-103388431222067/

***Important***Blogger is not wrote any recommendation & suggestion. All is personal
opinion and reader should take their own risk in investment decision.


Open to apply: 29 March 2024
Close to apply: 16 April 2024
Balloting: 19 April 2024
Listing date: 30 April 2024

Share Capital
Market cap: RM634.626 mil
Total Shares: 1.02359 bil shares

Industry CARG
Consumption of CPO (Indonesia), 2020 - 2023(e) : 5.70%
Exports CPO (Indonesia), 2020 – 2023: 0.2%
Consumption of CPKO (Indonesia), 2020 - 2023(e): 5.17%
exports of CPKO (Indonesia), 2020 - 2023(e): -3.51%
Industry competitors comparison (net profit%)
1. MKHOP Group: 9.2% (PE20.3)
2. Anglo-Eastern Plantations Plc: 21.37% (PE7.02)
3. PT Austindo Nusantara Jaya Tbk: 7.86% (PE53.27)
4. PT Teladan Prima Agro Tbk: 15.89% (PE10.31)
5. R.E.A. Holdings plc: 15.75% 
6. Kencana Agri Limited: 1.72%
7. NPC Resources Berhad: 0.27% (PE22.56)
8. PT Jaya Agra Wattie Tbk: -31.07% (losses)
9. PT Gozco Plantations Tbk: 13.67% (PE6.24)
10. Global Palm Resources Holdings Limited: 12.81%
11. PT Andira Agro Tbk: -0.9%  (losses)

Business (FYE 2023) 
Cultivation of oil palm and production and sale of CPO (Crude Palm Oil) and PK (Palm Kernel).
Segment
1. CPO: 91.7%
2. PK: 8.3%

Fundamental 
1. Market: Main Market
2. Price: RM0.62
3. Forecast P/E: 20.3 (FYE2023, EPS RM0.031)
4. ROE(Pro Forma ):  5.55%
5. ROE: 9.96% (FYE2023) ,21.41%(FPE2022), 36.64%(FYE2021), 14.98%(FYE2020)
6. Net asset: RM0.55
7. Total debt to current asset: 0.4396 (Debt: 67.802mil, Non-Current Asset: 476.762mil, Current asset: 154.228mil)
8. Dividend policy: 50% PAT dividend policy.
9. Shariah status: Yes

Past Financial Performance (Revenue, Earning Per shares, PAT%) 
2023 (FYE 30Sep): RM337.981 mil (Eps: 0.0310), PAT: 9.20%
2022 (FYE 30Sep): RM315.817 mil (Eps: 0.0590), PAT: 19.0%
2021 (FYE 30Sep): RM306.611 mil (Eps: 0.0760),PAT: 25.3%
2020 (FYE 30Sep): RM282.324 mil (Eps: 0.0180),PAT: 6.6%

Major customer (FYE2023) 
1. Apical Group of Companies: 82.0%
2. PT Energi Unggul Persada: 13.8%
3. Golden Agri-Resources Group of Companies: 3.90%
4. PT Samudra Biru Cemerlang: 6.3%
***100.00%

Major Sharesholders 
1. MKH: 28.68% (direct)
2. Tan Sri Alex Chen: 66.61% (indirect)
3. Tan Sri Eddy Chen: 66.50% (indirect)
4. Datuk Chen Fook Wah: 66.38% (indirect)
5. Metro Kajang (oversea): 30.65% (direct)

Directors & Key Management Remuneration for FYE2024
(from Revenue & other income 2022)
Total director remuneration: RRM6.171 mil
Key management remuneration: RM1.00 mil – RM1.250 mil
total (max): RM7.421 mil or 8.07%

Use of funds 
1. Expansion of land banks for oil palm plantation: 30.8%
2. Capital expenditures for existing plantation lands: 7.3%
3. Setup of PK crushing facility: 6.6%
4. Refurbishment and/or upkeep of existing palm oil mill: 8.9%
5. Capital expenditures for refurbishment and construction of workers/staff housing quarters: 7.3%
6. Capital expenditures to expand coverage of electricity supply 7.3
7. Repayment of loan due to a related party: 22.0%
8. Working capital: 2.5%
9. Estimated listing expenses: 7.30%

Conclusions (Blogger is not wrote any recommendation & suggestion. All is personal opinion and reader should take their own risk in investment decision)
Overall it should be categorized into low to mid growth potential of company.

*Valuation is only personal opinion & view. Perception & forecast will change if any new quarter result release. Reader take their own risk & should do own homework to follow up every quarter result to adjust forecast of fundamental value of the company.


Wednesday, March 27, 2024

TOPMIX BERHAD

Copyright@http://lchipo.blogspot.com/
Follow us on facebook: https://www.facebook.com/LCH-Trading-Signal-103388431222067/

***Important***Blogger is not wrote any recommendation & suggestion. All is personal
opinion and reader should take their own risk in investment decision.


Open to apply: 27 Mar 2024
Close to apply: 04 Apr 2024
Balloting: 08 Apr 2024
Listing date: 23 Apr 2024

Share Capital
Market cap: RM122.095 mil
Total Shares: 393.856 mil shares

Industry CARG
The surface decorative products market in Malaysiaa: 4.806%
Industry competitors comparison (net profit%)
1. Topmix: 13%
2. Polytec Laminates Sdn Bhd: 18.7%
3. Maica Corporation Sdn Bhd: 18.0%
4. Shimlen Sdn Bhd: 15.3%
4. ICA Innovation Sdn Bhd: 14.4%
5. Others: 0.4% to  13.2%% 

Business (FPE 2023) 
Marketing and sales of our own brands of surface decorative products. Also undertake the design of surface decorative products internally as well as in collaboration with third-party décor paper suppliers.
Product Revenue Segment 
1. HPL Product: 94.13%
2. Other surface decorative products: 5.33%
3. Kitchen and wardrobe accessories: 0.54%
***HPL : High pressure laminate (e.g. the surface layer of the compress wood)

Fundamental 
1. Market: Ace Market
2. Price: RM0.31
3. Forecast P/E: 15.88 (Forecass, EPS RM0.019525)
   *we disagree to follow Prospectus book pg 22 suggestion PE.
4. ROE(FPE2023):  12.77%
5. ROE: 28.33%(FYE2022), 20.48%(FYE2021), 13.34%(FYE2020)
6. Net asset: 0.15
7. Total debt to current asset: 0.5576  (Debt: 32.173mil, Non-Current Asset: 32.487mil, Current asset: 57.699mil)
8. Dividend policy: didn’t have formal dividend policy.
9. Shariah status: -

Past Financial Performance (Revenue, Earning Per shares, PAT%)  
2023 (FPE 30Sep): RM51.037 mil (Eps: 0.0141), PAT: 10.88%
2022 (FYE 31Dec): RM65.790 mil (Eps: 0.0217), PAT: 12.96%
2021 (FYE 31Dec): RM38.595 mil (Eps: 0.0112), PAT: 11.45%
2020 (FYE 31Dec): RM27.521 mil (Eps: 0.0060), PAT: 8.58%

Major customer (FPE 2023) 
1. Kai Cheong Hardware Trading Sdn Bhd: 8.90%
2. JBR Hardware & Trading Sdn Bhd: 6.50%
3. Ekia Furniture Accessories Sdn Bhd: 4.48%
4. Bao Leng Wood Veneer Plywood Sdn Bhd: 2.97%
5. Daiyon Marketing Sdn Bhd: 2.88%
***total 25.73%

Major Sharesholders  
1. Teo Quek Siang: 62.36% (indirect)
2. Tan Lee Hong: 66.64% (indirect)
3. J and T Resources: 55% (direct)

Directors & Key Management Remuneration for FYE2024 
(from Revenue & other income 2022)

Total director remuneration: RM1.776 mil
key management remuneration: RM0.65 mil – RM0.80 mil
total (max): RM2.576 mil or 10.969%

Use of funds 
1. Expansion into assembly of melamine faced chipboard (MFC) products: 20.74%
2. Business expansion, marketing and sales: 23.32%
3. General working capital: 44.24%
4. Estimated listing expenses: 11.70%
Conclusions (Blogger is not wrote any recommendation & suggestion. All is personal opinion and reader should take their own risk in investment decision)
Overall is high risk investment, and also come with grow opportunities. 

*Valuation is only personal opinion & view. Perception & forecast will change if any new quarter result release. Reader take their own risk & should do own homework to follow up every quarter result to adjust forecast of fundamental value of the company.

Tuesday, March 26, 2024

KEYFIELD INTERNATIONAL BERHAD

Copyright@http://lchipo.blogspot.com/
Follow us on facebook: https://www.facebook.com/LCH-Trading-Signal-103388431222067/


***Important***Blogger is not wrote any recommendation & suggestion. All is personal
opinion and reader should take their own risk in investment decision.


Open to apply: 26 Mar 2024
Close to apply: 03 Apr 2024
Balloting: 05 Apr 2024
Listing date: 22 Apr 2024

Share Capital
Market cap: RM720mil
Total Shares: 800 mil shares

Industry CARG
Accommodation work boat chartering market size in Malaysia (2017-2023e): 6.4% 
Industry competitors comparison (PAT%)
1.Keyfield Group: 27.1%
2.Alam Maritim (M) Sdn Bhd: 33.32%
3.Carimin Marine Services Sdn Bhd: 16.43%
4.DESB Marine Services Sdn Bhd: 12.11%
5.Perdana Petroleum Berhad: 6.72%
6.Icon Ship Management Sdn Bhd: Losses
7.Khas Jejaka Sdn Bhd: 6.3%
8.Petra Resources Sdn Bhd: losses
9.Petra Marine Sdn Bhd: 9.72%
10.Sapura Energy Berhad: losses

Business (FPE 2023)
Chartering of own & third party accommodation vessels and provision of related onboard services such as accommodation, catering, housekeeping, laundry and medical support services; and
Business Segments
1.Own vessels: 67.5%
2.Third party vessels: 32.5%

Fundamental
1.Market: Main Market
2.Price: RM0.90
3.Forecast P/E: 8.7
4.ROE(FPE2023): 18.85%
5.ROE: 25.86%(FYE2022), 12.40%(FYE2021), 10.44%(FYE2020)
6.Net asset: 0.63
7.Total debt to current asset: 1.08 (Debt: 186.888mil, Non-Current Asset: 527.372mil, Current asset: 172.357mil)
8.Dividend policy: 20% PAT dividend policy.
9. Shariah status: -

Past Financial Performance (Revenue, Earning Per shares, PAT%)
2023 (FPE 30Sep, 9mths): RM310.918 (Eps: 0.104), PAT: 27.1%
2022 (FYE 31Dec): RM236.204 mil (Eps: 0.0610), PAT: 21.10%
2021 (FYE 31Dec): RM139.756 mil (Eps: 0.0220),PAT: 12.90%
2020 (FYE 31Dec): RM75.231 mil (Eps: 0.0170),PAT: 18.00%

Major customer (FPE2023)
1.PCSB: 57.7%
2.Petra Resources Sdn Bhd: 7.7%
3.Malaysia Deepwater Production Contractors Sdn Bhd: 7.5%
4.Helms Geomarine Sdn Bhd: 4.3%
5.Perdana Nautika Sdn Bhd: 3.1%
***total 80.3%

Major Sharesholders 
1.Darren Kee: 22.3% (direct)
2.Kate Ooi: 22.3% (indirect)
3.Mohd Erwan: 6.9% (direct)
4.MEAM Holdings: 3.2% (direct)
5.Lavin Group: 26.1% (direct)
6.Veritas Aman: 5.3% (direct)
7.OM Ceria: 3.2% (direct)
8.Calvin Lau Chuen Yien: 26.1% (indirect)
9.Ikhlas Bin Kamarudin: 5.3% (indirect)
10.Tunku Azlan Bin Tunku Aziz: 3.2% (indirect)

Directors & Key Management Remuneration for FYE2024
(from Revenue & other income 2022)

Total director remuneration: RM3.601 mil
key management remuneration: RM1.10 mil – RM1.25 mil
total (max): RM4.851 mil or 5.42%

Use of funds
1.Redemption of Keyfield CRNCPS: 32.7%
2.Repayment of bank borrowings: 1.6%
3.Settlement of balance purchase consideration for Blooming Wisdom: 34.6%
4.Settlement of balance purchase consideration for Helms 1: 18.6%
5.Working capital: 7.7%
6.Estimated listing expenses: 4.8%
Conclusions (Blogger is not wrote any recommendation & suggestion. All is personal opinion and reader should take their own risk in investment decision)
Overall is high risk investment, oil & gas industry might become sunset industry in future. 

*Valuation is only personal opinion & view. Perception & forecast will change if any new quarter result release. Reader take their own risk & should do own homework to follow up every quarter result to adjust forecast of fundamental value of the company.

Wednesday, March 20, 2024

Quarter 1: Invest Group Performance Update

Congratulation to all group members ya. 

T&C to join Invest Group
1. Understand that all material in the Whatsapp Invest Group 2 or 3 is only opinion sharing.  
2. Members in group have to take their own risk. 
3. Memberships fee is not refundable. 
4. Admin is not take any responsible on member investment decision. 
5. Member have to do their own study & own analysis.
6. Memberships fees RM369.00 per year. 

Some detail on the Invest group
1. stock pick based on fundamental (sometime will use technical stock pick)
2. one year might less than 10 pick. 
4. is not a training class.
5. some counter that need to hold quite longer term.
6. No any other phone number is authorize, other than this admin number 013-2820766 

And REMEMBER, we never personal message / never advertise /  never call any member to offer any type of trading signal & no training class.  ALL member joint us is they have to personally come to contract us. If you received any call/ message is all SCAM!!!


Monday, March 18, 2024

SBH MARINE HOLDINGS BERHAD

Copyright@http://lchipo.blogspot.com/
Follow us on facebook: https://www.facebook.com/LCH-Trading-Signal-103388431222067/


Open to apply: 18 March 2024
Close to apply: 25 March 2024
Balloting: 27 March 2024
Listing date: 08 April 2024

Share Capital 
Market cap: RM195.360 mil
Total Shares: 888 mil shares

Industry CARG
Historical Market Size (in terms of Export Value) and Growth Forecast for the Frozen Seafood Market in Malaysia, 2023-2027 : 5.2% 
Industry competitors comparison (net profit%)
1.SBH: 6.7% (PE)
2.AASB: 14.5%
3.BAB: -4.7%
4.Emperor Marine: 1.2%
5.MAG: 17.0% (PE9.22)

Business (FPE 2023) 
Frozen seafood processing
-Aquaculture shrimp farming, processing, & sale of frozen seafood products.
Business Segments
1.Processing and sale of frozen seafood products: 68.71%
2.Merchant trading of frozen processed seafood products: 25.88%
3.Distribution and trading of aquaculture related products: 5.41%

Fundamental
1.Market: Ace Market
2.Price: RM0.22
3.Forecast P/E: 16.67 (Forecast, EPS RM0.0132)
4.ROE(FPE2023):  14.31%
5.ROE: 16.04%(FYE2022), 17.64%(FYE2021), 10.74%(FYE2020)
6.Net asset: 0.14
7.Total debt to current asset: 0.24 (Debt: 27.731mil, Non-Current Asset: 36.661mil, Current asset: 117.263mil)
8.Dividend policy: didn’t have formal dividend policy. 
9. Shariah status: Yes

Past Financial Performance (Revenue, Earning Per shares, PAT%) 
2023 (FPE 20Sep, 9mths): RM144.212 mil (Eps: 0.0095), PAT: 5.83%
2022 (FYE 31Dec): RM194.426 mil (Eps: 0.0147), PAT: 6.71%
2021 (FYE 31Dec): RM192.006 mil (Eps: 0.0147),PAT: 6.79%
2020 (FYE 31Dec): RM140.581 mil (Eps: 0.0094),PAT: 5.91%

Major customer (FPE 2023)
1.Customer F: 15.13%
2.Customer G: 11.93%
3.Customer A: 9.76%
4.Customer H: 9.24%
5.Customer C: 7.81%
Total top 5 customer: 53.87%

Major Sharesholders

1.TBN Holdings: 17.8% (direct)
2.Tan Boo Nam: 14.23% (direct)
3.Tan Yuak Ming: 6.84%  (direct)
4.Tan Yuak Kwang: 6.28%  (direct)
5.Tan Yok Jin: 6.28% (direct)

Directors & Key Management Remuneration for FYE2023 
(from Revenue & other income 2022)

Total director remuneration: RM4.104 mil
key management remuneration: RM0.55 mil – RM.75 mil
total (max): RM4.854 mil or 18.23%

Use of funds 
1.Development of Selinsing Farm: 40.40%
2.Construction of a new seafood processing plant: 16.42%
3.Purchase of machineries/equipment and motor vehicles: 15.4%
4.Working capital requirements: 17.68%
5.Estimated listing expenses: 10.10%

Conclusions (Blogger is not wrote any recommendation & suggestion. All is personal opinion and reader should take their own risk in investment decision)
Overall is risk is a bit high as PAT% is not high, and revenue not much grow over past 3 years. 

*Valuation is only personal opinion & view. Perception & forecast will change if any new quarter result release. Reader take their own risk & should do own homework to follow up every quarter result to adjust forecast of fundamental value of the company.

Wednesday, March 6, 2024

PROLINTAS INFRA BUSINESS TRUST

Copyright@http://lchipo.blogspot.com/
Follow us on facebook: https://www.facebook.com/LCH-Trading-Signal-103388431222067/
***Important***Blogger is not wrote any recommendation & suggestion. All is personal
opinion and reader should take their own risk in investment decision.

Open to apply: 06 Mar 2024
Close to apply: 12 Mar 2024
Price Determination Date: 13 Mar 2024
Balloting: 14 Mar 2024
Listing date: 25 Mar 2024
Share Capital
Market cap: RM nil mil
Total Shares: 1.100 bil shares

Industry CARG
CAGR of the Urban Highways Industry in Klang Valley in terms of Revenue, 2017-2027F: 3.2%
Total registered vehicles in KL and Selangor, 2017-2022: 1.8%
Industry competitors comparison (net profit%, FYE2022)
1. Prolintas Infra BT: losses
2. Amanat Lebuhraya Rakyat Berhad: 77.79% (average)
3. Bina Puri Holding Bhd: 5.6%
4. Ekovest Berhad: losses
5. IJM Corporation Berhad: 17.1%
6. Maju Holdings Sdn Bhd: 38.7%
7. PLUS Malaysia Berhad: nil
8. SKVE: losses
9. Taliworks: 45.90%

Business (FYE 2023)
(i) construction, toll collection, operation and maintenance of the Highways
(ii) provision of ancillary facilities to complement the operation of the Highways and enhance road users’ experience and convenience
Highways 
1. AKLEH: 16/05/1996 – 15/05/2037
2. GCE: 18/07/2000 – 31/05/2062
3. LKSA: 27/11/2006 – 31/07/2062
4. SILK: 08/10/1997 – 31/07/2062

Fundamental 
1.Market: Main Market
2.Price: RM0.95 (will follow final institutional price)
3.Forecast P/E: nil
4.ROE(FPE2023):  losses
5.ROE: losses(FPE2022), 49.92%(FYE2021), 4.45%(FYE2020)
6.Net asset: RM0.41
7.Total debt to current asset: 7.23 (Debt: 2.945 bil, Non-Current Asset: 3.188 bil, Current asset: 407.194 mil)
8.Dividend policy: 90% yearly distribution policy.
9.Shariah status: Yes

Past Financial Performance (Revenue, Earning Per shares, PAT%) 
2023 (FPE 30Sep, 9mths): RM228.570 mil (Eps: - 0.2340), -112.4%)
2022 (FYE 31Dec): RM384.161 mil (Eps: -0.0120), PAT: -3.5%
2021 (FYE 31Dec): RM365.800 mil (Eps: 0.1270),PAT: 38.3%
2020 (FYE 31Dec): RM394.372 mil (Eps: 0.0070),PAT: 1.9%

Major customer (2023) 
Customer base primarily comprises the road users using the four Highways. Did not have single major customer. 

Major Sharesholders 
1.Projek Lintasan Kota Holdings Sdn Bhd  : 51% (direct)
2.Permodalan Nasional Berhad : 51% (indirect)
3.Amanah Saham Bumiputera: 51% (indirect)
4.Yayasan Pelaburan Bumiputra: 51% (indirect)
5.Lembaga Tabung Haji: 5.5% (direct)
6.AIIMAN Asset Management Sdn. Bhd: 5.4% (direct)
7.AHAM Asset Management Berhad: 1.0% (direct)

Directors & Key Management Remuneration for FYE2023 
(from Revenue & other income 2022)
Total director remuneration: RM1.615 mil
key management remuneration: RM2.0 mil – RM2.15 mil
total (max): RM3.765 mil or 2.57% (compare from Profit from operation)

Use of Proceeds 
1.Selling unitholder: RM445.3 mil
2.Estimated listing expenses: 10.08mil
(Prolintas Infra BT will not be issuing any new Units for the IPO, the Trust will not receive any proceeds from the IPO)
Conclusions (Blogger is not wrote any recommendation & suggestion. All is personal opinion and reader should take their own risk in investment decision)
Overall is medium risk investment. PBT must over RM150mil to cover the finance cost. Still unable to know the final institutional price. Forecast reasonable acceptance price level should fall under RM0.52 – RM0.65 range.

*Valuation is only personal opinion & view. Perception & forecast will change if any new quarter result release. Reader take their own risk & should do own homework to follow up every quarter result to adjust forecast of fundamental value of the company.

Tuesday, March 5, 2024

ZANTAT HOLDINGS BERHAD

Copyright@http://lchipo.blogspot.com/
Follow us on facebook: https://www.facebook.com/LCH-Trading-Signal-103388431222067/

***Important***Blogger is not wrote any recommendation & suggestion. All is personal
opinion and reader should take their own risk in investment decision.
Open to apply: 06 March 2024
Close to apply: 13 March 2024
Balloting: 18 March 2024
Listing date: 27 March 2024

Share Capital 
Market cap: RM70 mil
Total Shares: 280 mil shares

Industry CARG
Global Export Value of Calcium Carbonate 2018-2022: 5.4%
Export Volume of Calcium Carbonate in Malaysia 2018-22: -17.2%
Export Value of Calcium Carbonate in Malaysia 2018-22: -6.2%
Consumption Volume of Calcium Carbonate in Malaysia 2018-22: 3.7%
Industry competitors comparison (net profit%)
1. Zantat Group: 4.8%
2. Weng Fatt Calcium Industry S/B: 6.8%
3. Imerys Minerals Malaysia S/B: 3.5%
4. ICB Carbonate Technologies S/B: 3.0%
5. Zillion Freight S/B: 1.7%
6. Others: -75.9% to -0.1%

Business (FYE 2023)
Production of calcium carbonate namely GCC and CC dispersions. Product is mostly use in construction and non-construction-related applications.
Revenue by segment
Production of calcium carbonate and kaolin: 97.1%
Other business activities: 2.9%
Revenu by Geo
Malaysia: 31.9%
India : 59.5%
Others: 8.6%

Fundamental 
1.Market: Ace Market
2.Price: RM0.25
3.Forecast P/E: 12.9
4.ROE(FPE2023):  10.04%
5.ROE: 9.44%(FPE2022), 11.83%(FYE2021), 10.98%(FYE2020)
6.Net asset: RM0.27
7.Total debt to current asset: 0.601  (Debt: 29.804mil, Non-Current Asset: 55.946mil, Current asset: 49.198mil)
8.Dividend policy: no formal dividend policy.
9. Shariah status: Yes

Past Financial Performance (Revenue, Earning Per shares, PAT%) 

2023 (FPE 30 Sep, 9mth): RM91.089 (Eps: 0.0200), PAT: 6.2%
2022 (FYE 31Dec): RM113.023 mil (Eps: 0.0190), PAT: 4.8%
2021 (FYE 31Dec): RM119.464 mil (Eps: 0.0230), PAT: 5.4

Major Sharesholders
1. CLHF Resources: 39.4% (direct)
2. Teh Ah Soon @ Teh Soon Tick: 6.6% (direct)
3. Chan Eng Hue: 5.9% (direct)
4. Chan Hup Ooi: 2.8% (direct)
5. Lee Mei Choon: 2.8% (direct)
6. Chan Bin Iuan: 2.8% (direct)
7. Chan Jee Chet: 2.8% (dire

Directors & Key Management Remuneration for FYE2024 
(from Revenue & other income 2022)

Total director remuneration: RM2.867 mil
key management remuneration: RM0.3 mil – RM0.35 mil
total (max): RM3.217 mil or 6.12%

Use of funds
1.Upgrading of R&D facilities: 27.4%
2.Upgrading of Calrock Perak Plant’s infrastructure: 7.2%
3.Investment in high efficiency machine components and industrial automation: 9.6%
4.Repayment of bank borrowings: 24.2%
5.Working capital: 10.2%
6.Estimated listing expenses: 21.4%
Conclusions (Blogger is not wrote any recommendation & suggestion. All is personal opinion and reader should take their own risk in investment decision)
Overall is low PAT% industry. Low growth & low PAT% industry. 
 
*Valuation is only personal opinion & view. Perception & forecast will change if any new quarter result release. Reader take their own risk & should do own homework to follow up every quarter result to adjust forecast of fundamental value of the company.

Friday, March 1, 2024

ALPHA IVF GROUP BERHAD

 Copyright@http://lchipo.blogspot.com/

Follow us on facebook: https://www.facebook.com/LCH-Trading-Signal-103388431222067/

***Important***Blogger is not wrote any recommendation & suggestion. All is personal
opinion and reader should take their own risk in investment decision.
Open to apply: 01 March 2024
Close to apply: 08 March 2024
Balloting: 12 March 2024
Listing date: 22 March 2024

Share Capital
Market cap: RM1,5552 bil
Total Shares: 4.860 bil shares

Industry CARG
Number of ART Cycles in Singapore 2015-2019: 5.2%
Total Fertility Rate in Malaysia 2011-2022: -3.1%
Number of Live Births in Malaysia 2017-2022: -4.2%
Total Fertility Rate in Singapore 2012-2022: -2.1%
Number of Live Births in Singapore 2018-2022: -2.0%
Industry competitors comparison (net profit%)
1.Alpha Group: 39.9%
2.KL Fertility & Gynaecology Centre S/B: 26%
3.Ecofiesta S/B: 25%
4.Metro Healthcare Berhad: 12.5%
5.Others: -317.4% to 30.2%

Business (FYE 2023)
Fertility care specialist focusing on the provision of assisted reproductive services.
Revenue by Geo
1.Selangor centre: 52.25%
2.Penang Centre: 27.5%
3.Singapore: 20.25%

Fundamental
1.Market: Ace Market
2.Price: RM0.32
3.Forecast P/E: 29.2
4.ROE(Pro Forma III): 35.46%
5.ROE:  100.43%(FPE2023), 38.98%(FPE2022), 4.75%(FYE2021), 12.19%(FYE2020)
6.Net asset: 0.0314
7.Total debt to current asset: 0.2465 (Debt: 39.656 mil, Non-Current Asset: 33.304mil, Current asset: 160.850mil)
8.Dividend policy: 60% PAT dividend policy.
9. Shariah status: -

Past Financial Performance (Revenue, Earning Per shares, PAT%) 
2023 (FPE Oct, 5 mths): RM65.904 mil (Eps: 0.0044), PAT: 32.18%
2023 (FYE,31May): RM99.562 mil (Eps: 0.0011), PAT: 39.85%
2022 (FYE 31May): RM91.094 mil (Eps: 0.0047), PAT: 25.23%
2021 (FYE 31May): RM62.063 mil (Eps: 0.0005),PAT: 3.71%
2020 (FYE 31May): RM68.955 mil (Eps: 0.0007),PAT: 5.02%
***EPS above using 4.860bil shares as diluted EPS.
***EPS in prospecture draft doesn’t use 4.860bil shares to calculate diluted EPS

Major customer
Business does not have single major customer.

Major Sharesholders 
1.Dato’ Dr. Lee Soon Soo, Colin: 34.01% (direct)
2.Lee Soon Ai: 8.91% (direct)
3.Dr. Ng Peng Wah: 8.32% (direct)
4.ACE Specialists: 9.15% (direct)
5.Dr.Leong Wai Yew : 6.58% (direct)
Directors & Key Management Remuneration for FYE2024
(from Revenue & other income forecast FPE2023 GP)
Total director remuneration: RM8.2115 mil
key management remuneration: RM1.35 mil – RM1.6 mil
total (max): RM9.8115 mil or 12.80%

Use of funds
1.Establishing new medical centres, satellite clinics and sales representative offices: 62.41%
2.Expansion and upgrade of existing medical centres, facilities and corporate office: 13.46%
3.Research and development: 1.89%
4.General working capital: 14.89%
5.General corporate purposes: 2.23%
6.Estimated listing expenses: 5.32%


Conclusions (Blogger is not wrote any recommendation & suggestion. All is personal opinion and reader should take their own risk in investment decision)
Overall is a good IPO & good business. But price offer at PE29.2 is not in discount. 

*Valuation is only personal opinion & view. Perception & forecast will change if any new quarter result release. Reader take their own risk & should do own homework to follow up every quarter result to adjust forecast of fundamental value of the company.


Wednesday, January 17, 2024

AGX GROUP BERHAD

Copyright@http://lchipo.blogspot.com/
Follow us on facebook: https://www.facebook.com/LCH-Trading-Signal-103388431222067/

***Important***Blogger is not wrote any recommendation & suggestion. All is personal
opinion and reader should take their own risk in investment decision.


Open to apply: 16 Jan 2024
Close to apply: 23 Jan 2024
Balloting: 26 Jan 2024
Listing date: 07 Feb 2024

Share Capital
Market cap: RM151.503 mil
Total Shares: 432.866 mil shares

Industry (CAGR 2018-2022)
Malaysia external trade activities: 11.5%
The Philippines external trade activities: 3.3%
Korea external trade activities: 3.1%
Singapore external trade activities: 6.3%
Industry competitors comparison (net profit%)
1. AGX Group: 5.8%
2. Harbour: 17.4% (PE3.7)
3. Trimode: 8.4% (PE15.85)
4. Swift: 7.6% (PE8.53)
5. Others Listed companies in Malaysia: -13.5% to 6.1%
6. Other Listed companies in the Philippines: -39.3% to -3.6%
7. Other Listed companies in Korea, Myammar, Singapore: -47.3% to 7.1%

Business (FPE 2023)
Third-party logistics service provider. 
Revenue by Segments
1. Sea freight forwarding: 36.76%
2. Air frieght forwarding: 17.11%
3. Aerospace logistics: 37.06%
4. Warehousing and other 3PL services: 5.68%
5. Road freight transportation: 3.39%
Revenue by Geographic market
1. Malysia: 16.43%
2. Philippines: 41.67%
3. Korea: 7.74%
4. Myanmar: 4.97%
5. Singapore: 10.48%
6. others: 18.71%

Fundamental
1.Market: Ace Market
2.Price: RM0.35
3.Forecast P/E: 12.68 (latest 12 month, EPS RM0.0276)
4.ROE(Pro forma III):  15.17%
5.ROE: 22.82%(FPE2023),29.87%(FYE2022), 15.14%(FYE2021), 18.53%(FYE2020),
6.Net asset: RM0.18
7.Total debt to current asset: 0.071 (Debt: 6.682mil, Non-Current Asset: 19.488mil, Current asset: 93.751mil)
8.Dividend policy:  30% PAT dividend policy.
9. Shariah status: Yes

Past Financial Performance (Revenue, Earning Per shares, PAT%) 
2023 (FPE 31Aug, 8mths): RM122.228 mil (Eps: 0.0172), PAT: 6.09%
2022 (FYE 31Dec): RM234.429 mil (Eps: 0.0313), PAT: 5.78%
2021 (FYE 31Dec): RM193.372 mil (Eps: 0.0137),PAT: 3.07%
2020 (FYE 31Dec): RM122.507 mil (Eps: 0.0013),PAT: 0.46%

Major customer (FPE 2023) 
1.Airasia Group: 27.37%
2.Kukdo Chemical Co.,Ltd: 7.16%
3.Autoliv Cebu Safety Manufacturing Inc: 3.49%
4.Moog Controls Corporation: 3.29%
5.Customer Group B: 2.83%
***total 44.15%

Major Sharesholders 
1. Dato’ Ponnudorai A/L Periasamy: 11.54%
2. Jayasielan A/L Gopal: 11.54%
3. Penu Mark: 17.6%
4. Neo Lip Pheng, Peter: 17.6% 
5. Maximino Baylen Gulmayo, Jr.: 4.97%

Directors & Key Management Remuneration for FYE2023 
(from Revenue & other income 2022)

Total director remuneration: RM3.413 mil
key management remuneration: RM1.5 mil – RM1.65 mil
total (max): RM5.063 mil or 10.04%

Use of funds 
1.Business expansion: 25.8%
2.Repayment of bank borrowings: 12.2%
3.Working capital: 48.7%
4.Estimated listing expenses: 13.3%
Conclusions (Blogger is not wrote any recommendation & suggestion. All is personal opinion and reader should take their own risk in investment decision)
Overall is high risk investment.  

*Valuation is only personal opinion & view. Perception & forecast will change if any new quarter result release. Reader take their own risk & should do own homework to follow up every quarter result to adjust forecast of fundamental value of the company.

Monday, January 15, 2024

WENTEL ENGINEERING HOLDINGS BERHAD

Copyright@http://lchipo.blogspot.com/
Follow us on facebook: https://www.facebook.com/LCH-Trading-Signal-103388431222067/


***Important***Blogger is not wrote any recommendation & suggestion. All is personal
opinion and reader should take their own risk in investment decision.
Open to apply: 15 Jan 2024
Close to apply: 22 Jan 2024
Balloting: 24 Jan 2024
Listing date: 06 Feb 2024

Share Capital
Market cap: RM299 mil
Total Shares: 1.150 bil shares

Industry (CAGR 2018-2022)
GDP of fabricated metal product industry: 1.0%
Sales value from machining, and treatment and coating of metals in Malaysia: 8.9%
GDP of machinery and equipment industry: 4.3%
Sales value of domestically manufactured machinery and equipment: 7.2%
Export value of machinery, equipment and parts: 11.7%
Industry competitors comparison (net profit%)
1. Wentel: 17.4%
2. MACE Instrumentation S/B : 13.4% (JHM: 28.09)
3. UWC: 19.8 % (PE126)
4. Dufu: 22% (PE50.45)
5. SFPtech: 37.3% (PE55.82)
6. CPETech: 20.9% (PE63.74)
6. Grand Venture Technology S/B: 19.2% (SGX: PE18.93)
7. Others: -2.8% to 14.6%

Business (FPE 2023)
Fabrication of semifinished metal products, fabrication of metal parts and assembly of finished products.
Revenue Segments
1. Fabrication of semifinished metal product: 75.56%
2. Fabrication of metal parts: 16.66%
3. Assembly of finished products: 7.78%
Revenue by Geo
1. Malaysia: 69.02%
2. Singapore: 30.48%
3. US: 0.50%

Fundamental
1.Market: Ace Market
2.Price: RM0.26
3.Forecast P/E: 18.51 (latest 12 month, EPS RM0.01405)
4.ROE(Pro forma II):  9%
5.ROE: 23.16%(FPE2022), 18.45%(FYE2021), 5.38%(FYE2020),
6.Net asset: RM0.14
7.Total debt to current asset: 0.1038  (Debt: 13.737mil, Non-Current Asset: 45.244mil, Current asset: 132.393mil)
8.Dividend policy: doesn’t have any formal dividend policy.
9. Shariah status: Yes
Past Financial Performance (Revenue, Earning Per shares, PAT%) 
2023 (FPE 30Sep, 9mths): RM72.129 mil (Eps: 0.0096), PAT: 15.25%
2022 (FYE 31Dec): RM117.540 mil (Eps: 0.0178), PAT: 17.42%
2021 (FYE 31Dec): RM89.854 mil (Eps: 0.0119),PAT: 15.25%
2020 (FYE 31Dec): RM64.759 mil (Eps: 0.0031),PAT: 5.53%

Major customer (FPE 2023) 
1. Rapiscan Group: 34.79%
2. Customer E Group: 31.36%
3. Makino Asia Pte Ltd: 17.25%
4. Customer D Group: 5.87%
5. Customer B Group: 4.57%
***total 92.84%

Major Sharesholders 
1. Wong Kim Fatt: 37.07% (direct)
2. Ban Kim Wah: 13.25% (direct)
3. Loo Sok Ching: 0.6% (direct)
4. WCSB: 16.56% (indirect)
5. Tai Yuan Heng: 4.77% (direct)

Directors & Key Management Remuneration for FYE2023 
(from Revenue & other income 2022)
Total director remuneration: RM0.952 mil
key management remuneration: RM1.054 mil – RM1.25 mil
total (max): RM2.202 mil or 7.06%

Use of funds 
1.Part finance the construction of 2 blocks factory & 2 blocks workers’ hostel: 56.31%  
2.Part finance the purchase of new machinery and equipment: 35.24%
3.Estimated listing expenses: 8.45%
Conclusions (Blogger is not wrote any recommendation & suggestion. All is personal opinion and reader should take their own risk in investment decision)
Overall is high risk investment, and also come with high grow return opportunities. 

*Valuation is only personal opinion & view. Perception & forecast will change if any new quarter result release. Reader take their own risk & should do own homework to follow up every quarter result to adjust forecast of fundamental value of the company.

Friday, January 12, 2024

HE GROUP BERHAD

Copyright@http://lchipo.blogspot.com/
Follow us on facebook: https://www.facebook.com/LCH-Trading-Signal-103388431222067/


***Important***Blogger is not wrote any recommendation & suggestion. All is personal
opinion and reader should take their own risk in investment decision.

Open to apply: 12 JAN 2024
Close to apply: 18 JAN 2024
Balloting: 22 JAN 2024
Listing date: 30 JAN 2024

Share Capital
Market cap: RM123.2 mil
Total Shares: 440 mil shares

Industry CARG
Value of Construction Work Completed for Non-Residential Buildings: -2.5%
Value of Construction Work Completed for Electrical Installation: 14.2%
Number of Applications for New Electrical Installations: 4.3%
Number of Applications for Existing Electrical Installations: 3.8%
Competitors comparison (PAT%)
1. HE Group: 5.7% (PE12.9)
2. LWE Engineering S/B: 10.6%
3. Hong Hin Electrical S/B: 
4. CBH Engineering S/B: 8.8%
5. PESTECH S/B: 4.1%
6. Kinergy Advancement Bhd: 1.5% (PE30.18)
7. Others: -0.4% to 7.2%

Business (FPE 2023)
Provision of power distribution system, other building systems and works, hook-up and retrofitting of electrical equipment and trading.
Revenue Segment
1. Power distribution: 66.54%
2. Other building system and works: 28.49%
3. Electrical equipment hook-up and retrofitting: 4.81%
4. Trading of electrical product: 0.16%

Fundamental
1.Market: Ace Market
2.Price: RM0.28
3.Forecast P/E: 12.90 (estimated latest 12 month, EPS RM0.0217)
4.ROE(Proforma III): 16.61%
5.ROE: 38.8%(FPE2022), 32.5%(FYE2021), 18.69%(FYE2020).
6.Net asset: RM0.10
7.Total debt to current asset: 0.732 (Debt: 87.464 mil, Non-Current Asset: 6.867mil, Current asset: 119.471mil)
8.Dividend policy: didn't have formal dividend policy.
9. Shariah status: Yes

Past Financial Performance (Revenue, Earning Per shares, PAT%)
2023 (FPE 31Aug, 8mth): RM138.577 mil (Eps: 0.0165), PAT: 5.24%
2022 (FYE 31Dec): RM107.573 mil (Eps: 0.0140), PAT: 5.73%
2021 (FYE 31Dec): RM100.461 mil (Eps: 0.0094), PAT: 4.12%
2020 (FYE 31Dec): RM31.388 mil (Eps: 0.0039), PAT: 5.41%

Order Book 
FYE2023: 22.993mil 
FYE2024: 188.916mil
Trade receivable vs revenue
2020: 33.3%
2021: 37.73%
2022: 39.6%
2023: 45.76%

Major customer (2023)
1. Customer A: 42.11%
2. Zalam Corporation Sdn Bhd: 31.95%
3. Customer C: 9.25%
4. Exyte Malaysia Sdn Bhd: 6.45%
5. Xeonics Co., Ltd: 4.59%
***total 94.35%

Major Sharesholders
1. Haw Chee Seng: 20.42% (direct)
2. Eng Choon Leong: 14.8% (direct)
3. Hexatech Energy Consolidated Sdn Bhd: 24.6% (direct)
4. Yong Chong Cheang: 24.6% (indirect)

Directors & Key Management Remuneration for FYE2023
(from Revenue & other income 2022)
Total director remuneration: RM0.884 mil
key management remuneration: RM0.85mil – RM1.1mil
total (max): RM1.984 mil or 13.22 %

Use of funds
1. Business expansion: 15%
2. Capital expenditure: 7.19%
3. Working capital: 62.19%
4.Estimated listing expenses: 15.62%
Conclusions (Blogger is not wrote any recommendation & suggestion. All is personal opinion and reader should take their own risk in investment decision)
Overall is reasonable price and but risk level is a bit high. 

*Valuation is only personal opinion & view. Perception & forecast will change if any new quarter result release. Reader take their own risk & should do own homework to follow up every quarter result to adjust forecast of fundamental value of the company.

Friday, January 5, 2024

KJTS GROUP BERHAD

 Copyright@http://lchipo.blogspot.com/

Follow us on facebook: https://www.facebook.com/LCH-Trading-Signal-103388431222067/

***Important***Blogger is not wrote any recommendation & suggestion. All is personal
opinion and reader should take their own risk in investment decision.


Open to apply: 05 Jan 2024
Close to apply: 11 Jan 2024
Balloting: 16 Jan 2024
Listing date: 26 Jan 2024

Share Capital
Market cap: nil (will need refer final institutional price)
Total Shares: 688 mil shares

Industry CARG (2018-22)
Value of Construction Work Completed for Electrical Installation in Malaysia: 14.2%
Value of Construction Work Completed for Plumbing, Heat and Air-conditioning Installation in Malaysia: 17.3%
Operating Revenue of Cleaning Activities in Singapore (2017-21): 0.2% 
Industry competitors comparison (PAT%)
KJTS Group: 7.6% (PE26)
UEM Edgenta Bhd: 1.8% (PE16.79)
GFM Services Bhd: 13.0% (PE8.65)
Widad Group Bhd: -3.8% (Losses)
Gas District Cooling (M) S/B: 15.3%
Others: -12.3% to 6.4%

Business (FPE 2023)  
Providing building support services comprising cooling energy, cleaning and FM services
Revenue by Segments
1. Cooling energy: 50.21%
2. Cleaning services: 39.12%
3. Facilities management: 10.67%

Fundamental
1.Market: Ace Market
2.Price: RM0.27 (will follow final institutional price)
3.Forecast P/E: 26.04 (forecast FPE2023, EPS RM0.01037)
4.ROE(Pro Forma III): 6.56%
5.ROE: 14.08%(FPE2023), 19.84%(FYE2022), 20.84%(FYE2021), 24.07%(FYE2020)
6.Net asset: 0.14
7.Total debt to current asset: 0.319 (Debt: 38.497mil, Non-Current Asset: 16.978mil, Current asset: 120.805mil)
8.Dividend policy: 20% PAT dividend policy.
9. Shariah status: Yes

Past Financial Performance (Revenue, Earning Per shares, PAT%)
2023 (FPE 30 July, 7mths): RM71.767 (Eps: 0.0062),PAT: 5.29%
2022 (FYE 31 Dec): RM94.438 mil (Eps: 0.0100),PAT: 7.58% 
2021 (FYE 31 Dec): RM85.285 mil (Eps: 0.0086),PAT: 7.01%
2020 (FYE 31 Dec): RM73.757 mil (Eps: 0.0078),PAT: 7.17%

Major customer (FPE 2023)
1. Bank Pembangunan Malaysia Berhad: 13.81%
2. Customer C: 10.36%
3. Micron Semiconductor (M) Sdn Bhd: 10.34%
4. Customer group A: 6.82%
5. Customer D: 4.69%
***total 46.02%

Major Sharesholders
1. Lee Kok Choon: 31.35%
2. Sheldon Wee Tah Poh: 31.35%
3. Yeow Boon Siang: 4.81%

Directors & Key Management Remuneration for FYE2023
(from Revenue & other income 2022)
Total director remuneration: RM1.874mil
key management remuneration: RM0.95mil – RM1.150mil
total (max): RM3.024 mil or 13.3%

Use of funds
1. Expansion of cooling energy segment: 68.66%
2. Expansion of offices in Malaysia, Thailand and Singapore: 7.64%
3. Working capital: 13.79%
4. Defraying the listing expenses: 9.91%


Conclusions (Blogger is not wrote any recommendation & suggestion. All is personal opinion and reader should take their own risk in investment decision)
Overall is a low PAT% industry. 

*Valuation is only personal opinion & view. Perception & forecast will change if any new quarter result release. Reader take their own risk & should do own homework to follow up every quarter result to adjust forecast of fundamental value of the company.