Sunday, December 26, 2021

Coraza Integrated Technology Berhad

Copyright@http://lchipo.blogspot.com/
Follow us on facebook: https://www.facebook.com/LCH-Trading-Signal-103388431222067/


***Important***Blogger is not wrote any recommendation & suggestion. All is personal opinion and reader should take their own risk in investment decision

Open to apply: 22/12/2021
Close to apply: 06/01/2022
Balloting: 10/01/2022
Listing date: 20/01/2022

Share Capital
Market Cap: RM119.932 mil
Total Shares: 428.331mil shares
 
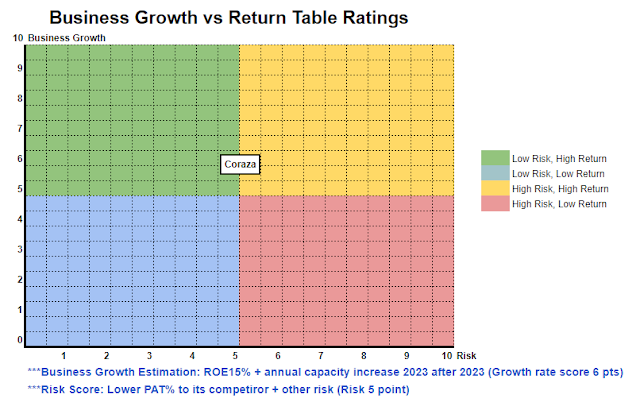
Industry Competitor PAT
Coraza: 9.6% (PE19)
Alpha: -7.7%
Frencken: 6.1% (PE18, SGX Mrk)
Kobay: 17.2% (PE60)
Synturn: 17.4% 
UWC: 26.4% (PE68)

Business (2021)
Sheet metal fabrication, Percision machining, & sub-modular assembly. 
Semicoductor: 56.5%
Instrumentation: 17.9%
Life science & medical devices: 18.7%
Aerospace, telecommunication and E&E: 6.9%

Revenue by Geo (2021)
M'sia: 61.9%
S'pore: 28.3%
USA: 7.8%
Others: 0.4%
Euro: 1.6%

Fundamental

1.Market: Ace Market
2.Price: RM0.28
3.P/E: 19 (EPS:0.0147)
4.ROE(Pro Forma III): 16.97% (forecast using 6mth FPE2021)
5.ROE: 27.4%(FYE2020), 12.2%(FYE2019), 14%(FYE2018)
6.NA after IPO: RM0.15
7.Total debt to current asset after IPO: 0.969(Debt: 44.952 mil, Non-Current Asset: 62.337 mil, Current asset: 46.386 mil)
8.Dividend policy: no formal dividend policy. 
 
Past Financial Performance (Revenue, Earning Per shares, PAT%)
2021 (6mths): RM43.195 mil (Eps:0.0126),PAT: 12.5%
2020: RM83.686 mil (Eps:0.0147),PAT: 7.5%
2019: RM58.594 mil (Eps:0.0080),PAT: 5.8%
2018: RM56.023 mil (Eps:0.0081),PAT: 6.2%

After IPO Sharesholding
Paul Heng Weng Seng: 48.3%
Liew Sow Ying: 19.3%
Lim Teik Hoe: 19.3% (indirect)

Directors & Key Management Remuneration for FYE2022 (from gross profit 2020)
Total director remuneration: RM0.73 mil
key management remuneration: RM0.6mil - 0.85mil
total (max): RM1.58 mil or 7.4%  
 
Use of fund
Purchase of new machinery: 47%
Construction of factory: 19.5%
Implementation of ERP system: 3.6%
Extension of existing buidling: 4.6%
Repayment of bank borrowings: 13.9%
Listing expenses: 11.4%

Highlight
1. New factory will increase 25% capicity (estimated completed by Dec2023). 

Good thing is:
1. Semiconductor industry on growing stage, PE19 is acceptable. 
2. ROE still above 15%.
3. Revenue growing for past 3 years. 
4. Director & key management remuneration is not high. 
5. IPO for expand business capacity. 
 
The bad things:
1. The company having concentration risk on 2 customer (66%-77% trade receivable from 2018-2021).
2. Director averaging above age 60. 
3. Competitor in same industry have better performance. 

Conclusions (Blogger is not wrote any recommendation & suggestion. All is personal opinion and reader should take their own risk in investment decision)
Overall is still a discount IPO compare to their competitor that get high PE in same industry. After IPO should able to back to acceptable PE30 & above. 

*Valuation is only personal opinion & view. Perception & forecast will change if any new quarter result release. Reader take their own risk & should do own homework to follow up every quarter result to adjust forecast of fundamental value of the company.

Monday, December 6, 2021

SWIFT HAULAGE BERHAD

Copyright@http://lchipo.blogspot.com/
Follow us on facebook: https://www.facebook.com/LCH-Trading-Signal-103388431222067/

Open to apply: 30/11/2021
Close to apply: 07/12/2021
Price determination date: 08/12/2021
Balloting: 09/12/2021
Listing date: 21/12/2021

Share Capital
Market Cap: RM916.5 mil
Total Shares: 889.8045mil shares
***Issue price RM1.03 (final price will finalise after institution offer completed)

Industry Competitor PE
Tasco: PE14
Freight Management:PE13.8
CJCen: PE50.46
Tnlogis: PE24.92
Xinhwa: PE19.34

Business (2021)
Integrated logistics services: Container haulage, land transportion, freight forwarding, warehousing & container depot. 
Other services: 3S for commercial vehicles, general insurance agency, E-commerce retailing. 

Revenue by Geo (2021)
Msia: 93.8%
Thailand: 2.8%
other countries: 3.4%

Fundamental
1.Market: Main Market
2.Price: RM1.03 (final price determined 08/12/2021)
3.P/E: 21.5 (EPS: 0.048)
4.ROE(Pro Forma III): 8.89% (forecast using 5mth FPE2021)
5.ROE: 9.8%(FYE2020), 9.45%(FYE2019), 12.17%(FYE2018)
6.Cash & fixed deposit after IPO: 0.0155
7.NA after IPO: RM0.35
8.Total debt to current asset after IPO: 3.1 (Debt: 0.751 bil, Non-Current Asset: 1.093 bil, Current asset: 0.235 bil)
9.Dividend policy: PAT 30% dividend policy. 
 
Past Financial Performance (Revenue, Earning Per shares, PAT%)
2021 (5mths): RM248.533 mil (Eps: 0.025),PAT: 9.0%
2020: RM555.838 mil (Eps: 0.047),PAT: 7.6%
2019: RM610.201 mil (Eps: 0.041),PAT: 6.1%
2018: RM496.979 mil (Eps: 0.046),PAT: 8.3%
***EPS is base on comprehesiove income divided 899.8045 mil shares (Diluted EPS in prospectures book didn't use enlarged shares after IPO). 

After IPO Sharesholding
Loo Yong Hui: 35.87% (indirect)
Dato' Haji Md Yusof: 35.87% (indirect)
Loo Hooi Keat: 35.87% (indirect)

Directors & Key Management Remuneration for FYE2022 (from gross profit 2020)
Total director remuneration: RM2.996 mil
key management remuneration: RM6 mil- 6.45 mil
total (max): RM9.446 mil or 5.09%  

Use of fund
Constuction of new warehouse: 17.6% (currently have 6 warehouse)
Puchase of land: 25.7% (currently have 2.381 mil sq haulage yards)
Purchase of 30 prime movers: 7.4% (currently have 966 Prime mover, 5402 trailers)
Repayment bank borrowings: 43.1%
Listing expenses: 6.2%

Highlight
1. New warehouse in Port Klang (estimated complete build 2nd quarter 2022). 
2. Acquisition of cold-chain logistics companies (3rd quarter 2022).

Good thing is:
1. Director & key management remuneration below 10%. 
2. The company business is almost near to life necessity and economic necessity industry. 
 
The bad things:
1. PE21.5 is above market average PE. 
2. ROE below 15%
3. Debt to current asset ratio is too high. 
4. Revenue did not growth much 2018-2021. 
5. PAT% margin is less than 10%, & averege industry competiror PAT also not over 10% PAT (profit after tax margin)
6. 43.1% IPO use to repayment of bank borrowing. 
7. Swift have 6 warehouse, expand 1 new warehouse highly chance will not double their revenue in 5 year. 
8. Purchase of 30 prime mover is small percentage of the total vehicle they have. 

Conclusions (Blogger is not wrote any recommendation & suggestion. All is personal opinion and reader should take their own risk in investment decision)
Overall is an expensive IPO. The industry profit after tax margin for the company averagely is below 10 (Swift PAT:  7.6%). Company IPO PE is a bit higher then the industry average. 
*Valuation is only personal opinion & view. Perception & forecast will change if any new quarter result release. Reader take their own risk & should do own homework to follow up every quarter result to adjust forecast of fundamental value of the company.

Monday, November 29, 2021

Aurelius Technologies Berhad

Copyright@http://lchipo.blogspot.com/
Follow us on facebook: https://www.facebook.com/LCH-Trading-Signal-103388431222067/

Open to apply: 29/11/2021
Close to apply: 03/12/2021
Price determination date: 6/12/2021
Balloting: 07/12/2021
Listing date: 16/12/2021

Share Capital
Market Cap: RM182.847 mil
Total Shares: 358.180 mil shares
***Issue price RM1.36 (final price will finalise after institution offer completed)

Industry  CAGR (2016-2020) in Malaaysia
Semiconductors: 18.5%
Electronic transistors: -0.4%
Integrated circuits: 3.7%

Business (Revenue in 2021)
Manufacturing of semiconductor product, EMS services 
Communications and IoT products: 83.5% 
Electronic devices: 13.8%
Semiconductor components: 2.7%

Revenue by Geo (2021)
Msia: 32.6%
Americas: 46.1%
Europe: 7.5%
Asia: 13.8%

Major Customer by revenue
Customer A: 29.8%, US (Communication devices)
Customer B: 20.2%, US (Communication devices)
Customer C: 23.8%, UK (Communication IoT devices)
Customer D: 9.8%, singapore & US (telematic instrumentation devices)
Customer E: 4.9%, German subsidairy to Cus B (Comunication devices) 
Customer F: New cus for expansion, China (IoT comunication product)

Fundamental
1.Market: Main Market
2.Price: RM1.36 (final price determined 6/12/2021)
3.P/E: 32.4 (EPS: 0.042)
4.ROE(Pro Forma III): 11.79% (forecast using 3mth FPE2022)
5.ROE: 17.95%(FYE2021), 32.62%(FYE2020), 27.33%(FYE2019)
6.Cash & fixed deposit after IPO: 0.143
7.NA after IPO: RM0.54
8.Total debt to current asset after IPO: 0.62 (Debt: 170.442mil, Non-Current Asset: 102.898mil, Current asset: 271.246mil)
9.Dividend policy: PAT 20% dividend policy. 
 
Past Financial Performance (Revenue, Earning Per shares, PAT%)

2021 (7mths): RM200.038 mil (Eps: 0.0369),PAT: 6.6%
2021: RM362.165 mil (Eps: 0.0421),PAT: 4.2%
2020: RM389.305 mil (Eps: 0.0659),PAT: 6.1%
2019: RM358.171 mil (Eps: 0.0667),PAT: 6.7%

Utilisation rate%
Jan 2019: 89%
Jan 2020: 91%
Jan 2021: 94%
Aug 2021: 93%

Unbilled orders
Nov 2021 - Jan 2022: RM164.064 mil
Feb 2022 - Apr 2022: RM85.276 mil
May 2022 - Nov 2023: RM233.335 mil

After IPO Sharesholding
Lee Chong Yeow (Age76) & Loh Hoch Chiang (Age56) : 71%. 

Directors & Key Management Remuneration for FYE2022 (from gross profit 2021)
Total director remuneration: RM1.3695 mil
key management remuneration: RM1.4 mil- 1.7 mil
total (max): RM3.0695 mil or  10.2%  

Use of fund
Machinery & equipment: 38.2%
Repayment borrowing: 28.2%
Working capital: 26.9%
Listing expenses: 6.7%

Highlight
1. Currently have 11 SMT production line. Plan to expand 2 line (2022) and 2 line (2023), annual capacity will increase 198.7%.
***Automated Assembly line. 
2. Development of lithium-ion battery pack system (expectd commerce 4th quarter 2022).

Good thing is:
1. Annual capacity will increase 198.7% after 2023.
2. Sunrise industry. 

The bad things:
1. PE32 quite high but is reasonable if capacity increase double in 2 years. 
2. EMS depend on award of contract from customer.
3. Over 90% trade receivable in USD, business revenue is highly sensitive for fluation of USD. 
4. Revenue did not increase for over 3 years. 
5. Director & key management remuneration quite high from the gross profit portion. 
6. Both major director ages is quite high. 

Conclusions (Blogger is not wrote any recommendation & suggestion. All is personal opinion and reader should take their own risk in investment decision)
Overall is a non-discount IPO. IPO PE32.4 is already price in the potential increase of the manufactury annual capacity.The future EPS will increase to reduce the PE back to normal (competitor at PE 15-25).

*Valuation is only personal opinion & view. Perception & forecast will change if any new quarter result release. Reader take their own risk & should do own homework to follow up every quarter result to adjust forecast of fundamental value of the company.

Saturday, October 16, 2021

Ecomate Holdings Berhad

Copyright@http://lchipo.blogspot.com/
Follow us on facebook: https://www.facebook.com/LCH-Trading-Signal-103388431222067/


Open to apply: 15/10/2021
Close to apply: 25/10/2021
Balloting: 28/10/2021
Listing date: 08/11/2021

Share Capital
Market Cap: RM115.5 mil
Total Shares: 350 mil shares

Industry  CAGR (2010-2020) & Competitor
M'sia Furniture production: CARG 3.8%
M'sia Furniture export: CARG 4.9%
Liihen: PE8.4 ROE15.79
Latitude: PE6.29 ROE9.31
Poh Huat: PE7.07 ROE13.55
Jaycorp: PE7.97 ROE15.48
SernKou: PE27.44 ROE15.78
SpringArt: PE16.93 ROE8.35

Business (Revenue in 2021)
Design & produce living room furniture, bedroom furniture, & others. 
M'sia: 45.2%
Asia: 19.2%
Europe: 11.2%
North America: 14.9%
Australasia: 9.5%

Fundamental
1.Market: Ace Market
2.Price: RM0.33
3.P/E: 13.56 (EPS: 0.243)
4.ROE(Pro Forma III): 33.3% (forecast using 3mth FPE2022)
5.ROE: 71%(FYE2021), 68.8%(FYE2020), 148%(FYE2019)
6.Cash & fixed deposit after IPO: 0.066
7.NA after IPO: RM0.08
8.Total debt to current asset after IPO: 0.6929 (Debt: 29.133mil, Non-Current Asset: 15.879mil, Current asset: 42.048mil)
9.Dividend policy: doest not have formal dividend policy. 
 
Past Financial Performance (Revenue, Earning Per shares, PAT%)

2022: (3mths): RM18.794 mil (Eps: 0.0069),PAT%: 12.8%
2021: RM56.342 mil (Eps: 0.0243),PAT%: 15.1%
2020: RM42.398 mil (Eps: 0.0166),PAT%: 12.3%
2019: RM24.141 mil (Eps: 0.0095),PAT%: 13.8%
***FYE 2021 (is Mar2020-Feb2021)
***FPE 2022 (Mar2021-May2021)

After IPO Sharesholding
Jason Koh Jian Hui: 33.1%
Koh Cheng Huat: 33.1%

Directors & Key Management Remuneration for FYE2022 (from gross profit 2021)
Total director remuneration: RM1.128 mil
key management remuneration: RM0.5 mil- 0.75 mil
total (max): RM1.878 mil or  10.6%  

Use of fund
Machinery & equipment: 37.1%
Factory & hostel contrustion: 12.4%
Purchase of raw material: 32.6%
Listing expenses: 17.9%

Highlight

1. Factory A: Currently have 4 production line & want to increase 1 production line. 
2. Muar Furniture Park: New factory 3 production line (Q4,2022 expected to be commerce).
3. Co-founder Age: Jason Koh(Aged 29), Koh Cheng Huat (Aged 44).
4. Incorporation in 2016: expand rapidly & take 5 year to listing in 2021

Good thing is:
1. ROE is above 30%
2. Revenue is double compare past 3 year. 
3. 82.1% IPO fund use to expand business. 
4. Both co-founder still below Age 50 (abilities to continue lead business to expand)

The bad things:

1. Selling PE is high compare to other competitor.
2. Concentration of customer base 39.8% (from 4 major customers).
3. Highly dependent on co-founder Jason Koh & Koh Cheng Huat to success & growth in business since 2016.

Conclusions (Blogger is not wrote any recommendation & suggestion. All is personal opinion and reader should take their own risk in investment decision)
Is a good IPO. Quite impressive because incorporate 2016 and IPO within 5years. The weakness is IPO price is expensive compare to average market PE. In consider of the additional production line PE13.56 still acceptable. 
*Valuation is only personal opinion & view. Perception & forecast will change if any new quarter result release. Reader take their own risk & should do own homework to follow up every quarter result to adjust forecast of fundamental value of the company.

Sunday, September 12, 2021

CEKD Berhad


Copyright@http://lchipo.blogspot.com/
Follow us on facebook: https://www.facebook.com/LCH-Trading-Signal-103388431222067/

Open to apply: 06/09/2021
Close to apply: 17/09/2021
Balloting: 21/09/2021
Listing date: 29/09/2021

Share Capital
Market Cap: RM93.395 mil
Total Shares: 194.573 mil shares

Industry  CAGR
CAGR 2020-2025: 3.2% (forecast) 
Competitors compare (Net profit margin%)
CEKD: 30.2%
Kentway: 0.3%
Marbach: 18.1%
Shanyu: 20.2%
Yip Lian: 11.2%

Business
Manufacturer of die-cutting moulds & trading of related consumables, tools and accessories. 
Malaysia: 85.6% (2020 revenue)
Other countries: 14.4% (2020 revenue)

Fundamental
1.Market: Ace Market
2.Price: RM0.48
3.P/E: 15.5 (EPS: 0.031)
4.ROE(Pro Forma III): 18.03% (forecast using 7mth FPE)
5.ROE: 16.10%(2020), 27.72%(2019), 28.86%(2018)
6.Cash & fixed deposit after IPO: 0.069
7.NA after IPO: RM0.31
8.Total debt to current asset after IPO: 0.44 (Debt: 11.245mil, Non-Current Asset: 46.1mil, Current asset: 25.3mil)
9.Dividend policy: doest not have formal dividend policy. 
 
Past Financial Performance (Revenue, Earning Per shares, PAT%)
2021 (7mths): RM17.705 mil (Eps: 0.0207),PAT%: 22.7%
2020: RM26.355 mil (Eps: 0.0310),PAT%: 22.9%
2019: RM28.363 mil (Eps: 0.0278),PAT%: 19.1%
2018: RM28.732 mil (Eps: 0.0350),PAT%: 25.4%

After IPO Sharesholding
Yap Tian Tion: 74% (indirect) 
Yap Kai Ning: 74% (indirect) 
Directors & Key Management Remuneration for FYE2021 (from gross profit 2020)
Total director remuneration: RM0.822 mil
key management remuneration: RM0.30 mil- 0.7mil
total (max): RM1.522 mil or  11.45%  

Use of fund
Acquisition of factory for Hotstar: 36.2%
Purchase of new machineries: 12.4%
Upgrade and development of computer softwares and server: 5.4%
Marketing activities: 6.2%
General working capital: 11%
Repayment of bank borrowing: 16.5%
Listing expenses: 12.3%

Highlight

1. Continue growth of Electrical & electronic manufacturing in ASEAN. 
2. Growth of paper and paper product industry.
3. Both factorys is to consolidate 3 old rented factory into new factory (1 by IPO fund, & 1 by financed through bank borrowings and/or internally generated funds.

Good thing is:
1. ROE is above 15%. 
2. Consolidate factory will increase efficientcy. 
3. Paper moulds and E&E industry both still is sunrise industry.

The bad things:
1. High competitor environment (M'sia have around 40 die-cutting moulds manufacturing.
2. Director & key management remuneration over 10% company gross profit. 
3. Use 16.5% IPO fund to repay bank borrowing. 
4. Factory consolidate did not represent add addional factory line to expand business. 
5. 2018-2020 revenue did not growth. 

Conclusions (Blogger is not wrote any recommendation & suggestion. All is personal opinion and reader should take their own risk in investment decision)
Average IPO. PE15.5 is just around fair PE. The attractive part in their business is the involved in produce steel related product for E&E industry which is the industry in growing.  

*Valuation is only personal opinion & view. Perception & forecast will change if any new quarter result release. Reader take their own risk & should do own homework to follow up every quarter result to adjust forecast of fundamental value of the company.

Saturday, July 3, 2021

Haily Group Berhad

Copyright@http://lchipo.blogspot.com/
Follow us on facebook: https://www.facebook.com/LCH-Trading-Signal-103388431222067/

Open to apply: 30/06/2021
Close to apply: 07/07/2021
Balloting: 12/07/2021
Listing date: 21/07/2021

Share Capital
Market Cap: RM61.929 mil
Total Shares: 178.32 mil shares

Industry  CAGR volume unit (Malaysia 2016-2020)
Residential : -1.5%
Commercial properties: -3.9%
Industrial properties: -4.0%

Competitors compare (Net profit margin%)
Haily: 6.3%
Kerjaya Prospek: 11.2%
AME Elite: 18.0%
GDB: 6.8%
others: -39.9% to 6.7%

Business
Construction is primarily involved in the building construction of residential and non-residential buildings.
Residential Buildings: 87.23%
Non-residential Buildings: 11.41%
Others: 1.36%

Fundamental
1.Market: Ace Market
2.Price: RM0.68
3.P/E: 11.6 (EPS: 0.0586)
4.ROE(Pro Forma III): 14.88%
5.ROE: 20.09%(2020), 20.18%(2019), 20.53%(2018), 33.04%(2017)
6.Cash & fixed deposit after IPO: 0.257
7.NA after IPO: RM0.39
8.Total debt to current asset after IPO: 0.56 (Debt: 84.821mil, Non-Current Asset: 6.052mil, Current asset: 148.959mil)
9.Dividend policy: 30% profit after tax dividend policy. 
 
Past Financial Performance (Revenue, Earning Per shares, PAT%)
2020: RM166.132 mil (Eps: 0.0586),PAT%: 5.86%
2019: RM157.918 mil (Eps: 0.0497),PAT%: 4.97%
2018: RM173.787 mil (Eps: 0.0474),PAT%: 4.74%
2017: RM121.832 mil (Eps: 0.0704),PAT%: 7.04% 

Order Book
2023: RM5.67mil
2022: RM124.23mil
2021: RM330.14mil

After IPO Sharesholding
See Tin Hai: 73.15% (indirect)
Directors & Key Management Remuneration for FYE2021 (from gross profit 2020)
Total director remuneration: RM2.144 mil
key management remuneration: RM0.4 mil- 0.5mil
total (max): RM2.644 mil or  9.62%  

Use of fund
Purchase of construction machinery, equipment, software, office equipment: 20.59%
Working capital: 29.41%
Repayment of bank borrowing: 34.31%
Listing expenses: 15.69%

Highlight
1. 2021 have RM330.14mil order book to be recognised. 
***doesn't other special item to be highlight. 

Good thing is:
1. PE11.6 is not consider too high. 
2. ROE still above 10%
3. Revenue increase from 2017 to 2020

The bad things:
1. PAT% is below 10%
2. Use 34.31% IPO fund to pay debt. 
3. Properties industry not going to high expand in 1-2 years. 

Conclusions (Blogger is not wrote any recommendation & suggestion. All is personal opinion and reader should take their own risk in investment decision)
Is a average IPO. Properties industry facing negative growth rate from 2016-2020, estimated should be continue to negative this year on lockdown continue. For 3years business growth prospect & risk score please refer to below chart. 

*Valuation is only personal opinion & view. Perception & forecast will change if any new quarter result release. Reader take their own risk & should do own homework to follow up every quarter result to adjust forecast of fundamental value of the company.

Thursday, July 1, 2021

CTOS Digital Berhad

Copyright@http://lchipo.blogspot.com/
Follow us on facebook: https://www.facebook.com/LCH-Trading-Signal-103388431222067/

Open to apply: 30/06/2021
Close to apply: 06/07/2021
Balloting: 08/07/2021
Listing date: 19/07/2021

Share Capital
Market Cap: RM411.896 mil
Total Shares: 2,200 mil shares

Industry (Net Profit %)
M'sia 2016-2020 CAGR: 12.9%
M'sia 2016-2025E CAGR: 12.7%
ASEAN 2016-2020 CAGR: 12.8%
ASEAN 2016-2025E CAGR: 11.4%

Competitors compare (EBITDA%)
CTOS: 36.9%
Experian: 24%
CBM: 13.9%

Business
Credit bureaux in the ASEAN region
Malaysia: 94.8%
International B2B: 5.2%

Fundamental
1.Market: Main Market
2.Price: RM1.10
*Institutional price to be determined
*If final price less then RM1.10, balance will be refund. 
3.P/E: PE61.8 (EPS: 0.0178)
4.ROE(Pro Forma III): 13.18%
5.ROE: 32.81%(2020), 49.41%(2019), 49.40%(2018),
6.Cash & fixed deposit after IPO: 0.0264
7.NA after IPO: RM0.13
8.Total debt to current asset after IPO: 0.507 (Debt: 41.469mil, Non-Current Asset: 247.716mil, Current asset: 81.829mil)
9.Dividend policy: 60% profit after tax dividend policy. 
 
Past Financial Performance (Revenue, Earning Per shares, PAT%)

2020: RM141.496 mil (Eps: 0.0178),PAT%: 27.9%
2019: RM129.141 mil (Eps: 0.0177),PAT%: 30.2%
2018: RM110.465 mil (Eps: 0.0135),PAT%: 26.8%

After IPO Sharesholding
Creador II: 40% (indirect)
Chung Tze Keong:4.5%
Chung Tze Wen: 4.5%

Directors & Key Management Remuneration for FYE2021 (from gross profit 2020)
Total director remuneration: RM1.909mil
key management remuneration: RM3.25mil- 3.5mil
total (max): RM5.409 mil or 4.45 %  

Use of fund
Repayment bank borrowing: 70.5%
Acquisition to be identified: 26.7%
Listing expenses: 2.8%

Highlight
1. Competitive advantage: limited number of player able to offer the full suite of digital solutions in Malaysia.
2. Market share in 2020 (Malaysia): 71.2%
3. Expand to Philippines (2020 acquired 51% CIBI)
4. Expand to Thailand (2020 acquired 20% BOL)

Good thing is:
1. High growth, high margin, Consistent ROE business. 
2. Less competitors.
3. Revenue continue on growing.
4. Expand to other ASEAN countries. 
5. Director & key management remuneration at acceptable category. 

The bad things:
1. High PE, at PE61.8
2. 70.5% IPO fund for repayment bank borrowing.

Conclusions (Blogger is not wrote any recommendation & suggestion. All is personal opinion and reader should take their own risk in investment decision)
Is a charging premium PE IPO, with PE61.8. If CTOS successful cases able to duplicate into other ASEAN countries, it will worth this price (if fail to duplicate their successful cases, investor need hold long period for return of capital). 
Futures 3 year estimation for business expansion & risk sorce, please refer to below chart. 

*Valuation is only personal opinion & view. Perception & forecast will change if any new quarter result release. Reader take their own risk & should do own homework to follow up every quarter result to adjust forecast of fundamental value of the company.

Wednesday, June 23, 2021

Ramssol Group Berhad

Copyright@http://lchipo.blogspot.com/
Follow us on facebook: https://www.facebook.com/LCH-Trading-Signal-103388431222067/

Open to apply: 22/06/2021
Close to apply: 29/06/2021
Balloting: 02/07/2021
Listing date: 13/07/2021

Share Capital
Market Cap: RM100.373 mil
Total Shares: 223.0515 mil shares
Industry (Net Profit %)
Employee engagement platforms market, 2017-2020: CAGR 14.69%

Competitors compare (Profit before tax margin%)
Accenture PLC: PE33.8
Capgemini SE: PE28
HCL Technologies Limited: PE21.13
Infosys Limited: PE33
International Business Machines Corporation: PE24
Tech Mahindra Limited: PE21
Wipro Limited:PE28

Business
1. HCM: Human Capital Management (Consulting and implementation, Sale of software licences, Technical support and maintenance services).
2. IT staff augmentation services
3. HCM technology applications
Malaysia: 45.53%
Singapore: 11.37%
Thailand: 29.82%
Indonesia: 13.07%
Others: 0.21%

Fundamental
1.Market: Ace Market
2.Price: RM0.45 (EPS:RM0.034)
3.P/E: PE13.24
4.ROE(Pro Forma III): 32.22%
5.ROE: 103%(2020), -%(2019), 16.16%(2018), 2.95%(2017)
6.Cash & fixed deposit after IPO: 0.0509
7.NA after IPO: RM0.10
8.Total debt to current asset after IPO: 0.288 (Debt:6.922mil, Non-Current Asset: 4.594mil, Current asset: 24.049mil)
9.Dividend policy: No fixed dividend policy. 

Past Financial Performance (Revenue, Earning Per shares, PAT%)
2020: RM25.331 mil (Eps: 0.0340),PAT%: 29.74%
2019: RM15.439 mil (Eps: 0.0200),PAT%: 29.11%
2018: RM12.549 mil (Eps: 0.0007),PAT%: 1.41%
2017: RM6.808 mil (Eps: 0.0004),PAT%: 1.29%
*EPS 2020 & 2019 prospecture book pg234 might not correct. 

After IPO Sharesholding (Director)
Dato’ CM Vignaesvaran A/L Jeyandran: 0.11%
Tan Chee Seng: 33.26%
Lee Miew Lan: 17.84%
Liew Yu Hoe: 1.63%
Goh Keng Tat: 0.11%
Sim Seng Loong @ Tai Seng: 0.11%

Directors & Key Management Remuneration for FYE2021 (from gross profit 2020)
Total director remuneration: RM2.125 mil
key management remuneration: RM0.3 mil- 0.35mil
total (max): RM2.475 mil or 16.13%  

Use of fund
Business expansion into Philippines: 9.98%
Expansion of Feet’s and Lark in Southeast Asia: 25.30% 
R&D Research: 16.34%
Working capital: 30.13%
Listing expenses: 18.25%

Highlight
1. Expansion business into Philippines.
2. Expansion of Feet’s and Lark in Southeast Asia
3. Have successful experience in Msia, S'pore, Thailand & Indonesia. 

Good thing is:
1. PE13.24 is accepetable. 
2. Revenue from multiple country. 
3. IPO fund 81.75% use for business expansion.
4. Revenue is increase over the 4 years. 

The bad things:
1. ROE is not stable (ROE unable to use for estimationd). 
2. Trade receivable sudently increase to RM11.805mil in 2020 (not overdue yet).
3. 18.25% IPO fund use for listing expenses is over average lisiting expenses percentage.
4. Directors & top management remuneration is over 16% from the gross profit. 

Conclusions (Blogger is not wrote any recommendation & suggestion. All is personal opinion and reader should take their own risk in investment decision)
This is a IPO company that seek for expansion. Reader have to aware on the unable of the ROE, & have to hold it for aim for growth. It consider high risk and also come with high return potential category come company. This is not a dividend / passive income generated company for investor at this moment. For more on risk vs business expand ratio can refer to below chart. 

*Valuation is only personal opinion & view. Perception & forecast will change if any new quarter result release. Reader take their own risk & should do own homework to follow up every quarter result to adjust forecast of fundamental value of the company.

Yenher Holdings Berhad


Copyright@http://lchipo.blogspot.com/
Follow us on facebook: https://www.facebook.com/LCH-Trading-Signal-103388431222067/

Open to apply: 22/06/2021
Close to apply: 01/07/2021
Balloting: 05/07/2021
Listing date: 15/07/2021

Share Capital
Market Cap: RM177.384mil
Total Shares: 300mil shares

Industry (Net Profit %)
Production Value of Livestock in Malaysia (CAGR): 6.6%
Growth Forecast for the Animal Health and Nutrition Industry (CAGR 2021-25): 4.3%

Competitors compare (Profit before tax margin%)
Yenher: 14.6% (PE12.72)
Peterlabs: 6.8% (PE20.36)
AsiaVet: loss making
RhoneMa: 7.9% (PE17.16)
Danberg: 12%
Ritamix: 10.9% (PE23.49)
Sunzen: loss making

Business
Manufacturing and distribution of animal health and nutrition products.
Distribution: 44.26%
Manufacturing: 55.74%
Local market: 89.77%
Overseas market: 10.23%

Fundamental
1.Market: Main Market
2.Price: RM0.95 (EPS:RM0.0747)
3.P/E: PE12.72
4.ROE(Pro Forma III): 12.70%
5.ROE: 19.39%(2020), 18.73%(2019), 31.30%(2018), 22.09%(2017)
6.Cash & fixed deposit after IPO: 0.2144
7.NA after IPO: RM0.59
8.Total debt to current asset after IPO: 0.16 (Debt: 25.452mil, Non-Current Asset: 46.345mil, Current asset: 155.502mil)
9.Dividend policy: 40% PAT dividend policy. 

Past Financial Performance (Revenue, Earning Per shares, PAT%)
2020: RM202.635 mil (Eps: 0.0951),PAT%: 10.73%
2019: RM179.061 mil (Eps: 0.0838),PAT%: 15.07%
2018: RM181.109 mil (Eps: 0.1158),PAT%: 11.03%
2017: RM177.380 mil (Eps: 0.0808),PAT%: 11.05%

After IPO Sharesholding
CGH Holding: 45%
-Cheng Moon Tat: 7.5% direct, indirect 45%
-Cheng Mooh Kheng: 3.5% direct, indirect 45%
-Cheng Mooh Chye: 3.5% direct, indirect 45%

Directors & Key Management Remuneration for FYE2021 (from gross profit 2020)
Total director remuneration: RM7.483
key management remuneration: RM0.70mil-0.95mil
total (max): RM8.433mil or 16.09%  

Use of fund
Construction of new GMP-Compliant Manufacturing Plant: 50.64%
Purchase of new machinery & equipment: 15.85%
Working capital: 27.30%
Listing expenses: 6.21%

Highlight
1. Current manufacturing production utilisation rate at 100%. 
2. New Manufacturing plant increase produce
-Complete feed & formulated product: 353.75% (573 to 2600 tones)
-Biotech animal feed ingredients: 422.65% (287 to 1,500 tones)
3. New Manufacturing plant to be completed build fourth quarter of 2023.
4.  Expand to more oversea market.

Good thing is:
1. PE12.72 below average competitor PE. 
2. Debt is not high. 
3. Have fixed dividend policy. 
4. Revenue increase of 4 years.
5. Almost all IPO fund use to expand business. 
6. by 2023 production increase 300%-400%

The bad things:
1. Nett profit around 10%. 
2. Industry growing CAGR is low 4.3%
3. Director & top management remuneration taking aways 16.09% gross revenue. 
4. Three main director age above 52.

Conclusions (Blogger is not wrote any recommendation & suggestion. All is personal opinion and reader should take their own risk in investment decision)
Is a little bit discounted IPO. With the new manafucturing facilites (to be completed by 2023), we should able to see better  revenue grow in business. Business grwoth & risk refer to below chart.  

*Valuation is only personal opinion & view. Perception & forecast will change if any new quarter result release. Reader take their own risk & should do own homework to follow up every quarter result to adjust forecast of fundamental value of the company.

Tuesday, June 8, 2021

Nestcon Berhad


Copyright@http://lchipo.blogspot.com/
Follow us on facebook: https://www.facebook.com/LCH-Trading-Signal-103388431222067/

Open to apply: 08/06/2021
Close to apply: 17/06/2021
Balloting: 21/06/2021
Listing date: 29/06/2021

Share Capital
Market Cap: RM180.270mil
Total Shares: 643.822mil shares

Industry (Net Profit %)
Growth forecast Construction Industry CAGR: 7.3%
Growth forecast Real Estate Construction market CAGR: 5.1%
Growth forecast Civil Englineering & Specialised CAGR: 9.1%

Competitors compare (Net profit margin%)
Nestron: 5.6% (PE12.61)
GDB: 9.3% (PE19.88)
Inta Bina: 4.6% (PE15.92)
MGB:2.8% (PE20.97)
Pesona Metro: 2.8% (loss making)
TCS: 10.7% (PE12.87)

Business
Building segment: 57.9% (residential, commercial, industrial & other)
Civil engineering & infra: 42.1% (earthworks, roadworks, drainage & other)

Fundamental
1.Market: Ace Market
2.Price: RM0.28 (EPS:RM0.0222)
3.P/E: PE12.61
4.ROE(Pro Forma III): 12.58%
5.ROE: 19.80%(2020), 27.21%(2019), 23.93%(2018), 17.75%(2017)
6.Cash & fixed deposit after IPO: 0.15
7.NA after IPO: RM0.18
8.Total debt to current asset after IPO: 1.02 (Debt: 253.785mil, Non-Current Asset: 120.584mil, Current asset: 246.884mil)
9.Dividend policy: Does not have any formal dividend policy. 

Past Financial Performance (Revenue, Earning Per shares)
2020: RM344.479 mil (Eps: 0.0222)
2019: RM422.786 mil (Eps: 0.0227)
2018: RM217.764 mil (Eps: 0.0116)
2017: RM190.857 mil (Eps: 0.0085)

Order book
To be billed next 1-3 years: RM1.212 bil.
Net Profit Margin
2020: 4.2%
2019: 3.7%
2018: 4.5%
2017: 3.1%

After IPO Sharesholding
Mohd Noor Bin Setapa: 0.1%
Datuk Ir.Dr.Lim: 60%
Ong Yong Chuan: 10%
Lim Joo Seng: 0.3%
Nor Azzam bin Abdul Jalil: 0.1%
Yeoh Sheong Lee: 0.1%

Directors & Key Management Remuneration for FYE2021 (from gross profit 2020)
Total director remuneration: RM1.861 mil or 5.59%
key management remuneration: RM1.05 mil - 1.3mil or 3.15%-3.91%
total (max): RM3.161 mil or 9.50%  

Use of fund
Establish IBS facilitiy: 13.3%
Acquire machineries & equipment: 14.7%
Upgrade software and system: 2.2%
Repayment bank borrowings: 36.6%
Working capital: 24.3%
Listing expenses: 8.9%

Good thing is:
1. IPO price at average PE, not consider expensive.  
2. ROE have over 10%
3. Having enought order to sustain next 3 year revenue. 
4. IPO in low PE environment time.

The bad things:
1. Having low net profit after tax (less than 5%)
2. Did not have dividend formal policy.
3. Debt ratio is a bit high. 
4. Use 36.6% IPO fund to pay debt. 

Conclusions (Blogger is not wrote any recommendation & suggestion. All is personal opinion and reader should take their own risk in investment decision)
Is a normal IPO. Able to get other competitor that have better performance compare to this company. 

*Valuation is only personal opinion & view. Perception & forecast will change if any new quarter result release. Reader take their own risk & should do own homework to follow up every quarter result to adjust forecast of fundamental value of the company.

Saturday, June 5, 2021

Pekat Group Berhad


Copyright@http://lchipo.blogspot.com/
Follow us on facebook: https://www.facebook.com/LCH-Trading-Signal-103388431222067/

Open to apply: 02/06/2021
Close to apply: 10/06/2021
Balloting: 14/06/2021
Listing date: 23/06/2021

Share Capital
Market Cap: RM206.389mil
Total Shares: 644.968mil shares (Public apply: 32.248mil, Company Insider/Miti/Private Placement/other: 138.667mil)

Industry
Solar PV Installation CAGR: 50.3% (2015-2019)
Solar PV Module price: CAGR -21.1% (RM/W)
Competitors (PE)
Solarevst: 52.63 
Samaiden: 60.4

Business
1.Solar Division: Design, Supply & Installation of solar PV system and power plants.
2.ELP division: Supply and installation of ELP System.
3.Trading Division: Distribution of electrical products and accessories.

Fundamental

1.Market: Ace Market
2.Price: RM0.32 (EPS:RM0.021)
3.P/E: PE15.2
4.ROE(Pro Forma III): 13%
5.ROE: 21.3%(2020), 31.2%(2019), 29.5%(2018), 36.6%(2017)
6.Cash & fixed deposit after IPO: RM0.0586 per shares
7.NA after IPO: RM0.16
8.Total debt to current asset after IPO: 0.446 (Debt: 50.937mil, Non-Current Asset: 41.109mil, Current asset: 114.178mil)
9.Dividend policy: no formal dividend policy. 

Past Financial Performance (Revenue, Earning Per shares)
2020: RM125.562 mil (Eps: 0.0210)
2019: RM119.521 mil (Eps: 0.0230)
2018: RM120.129 mil (Eps: 0.0170)
2017: RM72.830 mil (Eps: 0.0150)

Net Profit Margin
2020: 10.8%
2019: 12.4%
2018: 9.2%
2017: 13.0%

Order book
2021: RM117.2 mil
2022: RM24.8 mil
2023: RM11.5 mil

After IPO Sharesholding

Chin Soo Mau: 34.9%
Tai Yee Chee: 10.4%
Wee Chek Aik: 8.6%
Hextar (Stock code 5151): 19.6%

Directors & Key Management Remuneration for FYE2021 (from gross profit 2020)
Total director remuneration: RM2.548 mil or 6.68%
key management remuneration: RM0.90 mil - 1.05mil or 2.36%- 2.75%
total (max): RM3.598 mil or 9.4%  

Use of fund
Contrusction of new head office and operation facilities: 40.6%
Working capital: 28.6%
Repayment of bank borrowings: 22.5%
Listing expenses: 8.3%

Good thing is:

1. PE15 is a fair value. 
2. Sunrise industry (clean energy demand increase, lower solar PV module price). 
3. Competitor from same industry with high PE (over 50). 
4. Revenue increase over 4 years.

The bad things:
1. Use 22.5% of IPO fund to pay debt.  
2. Drop in ROE%
3. No formal dividend policy. 
4. Director & management remuneration near to 10%. 

Conclusions (Blogger is not wrote any recommendation & suggestion. All is personal opinion and reader should take their own risk in investment decision)
Consider a an attractive IPO. The offer price of IPO RM0.32 (PE15) much lower compare to same industry competitor. Overall business activities is on sunrise industry & the industry expected to continue growth globally.  
*Valuation is only personal opinion & view. Perception & forecast will change if any new quarter result release. Reader take their own risk & should do own homework to follow up every quarter result to adjust forecast of fundamental value of the company.

Friday, April 30, 2021

Tuju Setia Berhad

Copyright@http://lchipo.blogspot.com/
Follow us on facebook: https://www.facebook.com/LCH-Trading-Signal-103388431222067/

Open to apply: 26/04/2021
Close to apply: 05/05/2021
Listing date: 19/05/2021

Share Capital
Market Cap: RM221.780mil
Total Shares: 316.828mil shares (Public apply: 15.842mil, Company Insider/Miti/Private Placement/other: 91.683mil)

Industry (Net Profit %)
Building construction for Residential & Non-residential buidling. 
Tuju Setia: 6.4% (average 4 year 3.81%)
WCT: -10.8%
Suncon: 4.7%
Kerjaya: 11.2%
Vizione: -2.2%
GDB: 6.8%
Inta bina: 2.9%
TCS: 6.7%
Gagasan Nadi Cergas: 5.4%
Rimbaco: 3.4%

Business
M'sia: 100%

Fundamental
1.Market: Main Market
2.Price: RM0.70 (EPS:RM0.0513)
3.P/E: PE13.65
4.ROE(Pro Forma III): 16.5%
5.ROE: 30%(2020), 35%(2019), 31%(2018), 33%(2017)
6.Cash & fixed deposit after IPO: RM0.2458 per shares
7.NA after IPO: RM0.31
8.Total debt to current asset after IPO: 0.66 (Debt: 135.120mil, Non-Current Asset: 31.077mil, Current asset: 202.352mil)
9.Dividend policy: PAT 25% dividend policy.

Past Financial Performance (Revenue, Earning Per shares)
2020: RM255.768 mil (Eps: 0.0636)
2019: RM421.635 mil (Eps: 0.0369)
2018: RM327.794 mil (Eps: 0.0281)
2017: RM292.385 mil (Eps: 0.0230)

Net Profit Margin
2020: 6.36%
2019: 3.69%
2018: 2.71%
2017: 2.5%

Order book
2021: RM21.914 mil
2022: RM174.353 mil
2023: RM388.437 mil
2024: RM365.53 mil

After IPO Sharesholding
Wee Eng Kong: 44.37%
Dato' Wee Beng Aun: 21.86%
Wee Beng Chuan: 0.16%
Datin Seri Raihanah: 0.08%
Loo Ming Chee: 0.08%
Nor Adha bin Yahya: 0.08%

Directors & Key Management Remuneration for FYE2021 (from gross profit 2020)
Total director remuneration: RM2.084 mil or 8.96%
key management remuneration: RM1.45 mil - 1.7mil or 6.23%-7.30%
total (max): RM3.784 mil or 16.27%  

Use of fund
Capital Expenditure (Machines/equitment/Software): 42.86%
Capital Expenditure (Land/storage facilities): 14.28%
Working capital: 33.93%
Listing expenses: 8.93%

Good thing is:
1. PE13.65 is not too high & have good ROE.  
2. Still have some order book to sustain revenue until 2024. 
3. Have clear dividend policy. 
4. Most IPO fund to expand business activities. 

The bad things:
1. Company having high payable in liabilties. Grearing including payable is 2.49 in 2020. 
2. Overall 4 year revenue almost no increase. 
3. Major sharesholder age 60 & 63 (need more study on succession plan, & abilities of get new project). 
4. RM13.3mil (70%) of working capital from IPO fund to pay subcontractor services (payable in liabilities RM104mil). 
5. Net profit margin didn't exceed 10%.
6. Director & key management fees exceeded 10% of company gross profit. 

Conclusions (Blogger is not wrote any recommendation & suggestion. All is personal opinion and reader should take their own risk in investment decision)
Consider a normal IPO. Construction of buidling activities might need to take another few year in Malaysia to see better growth. Please refer below 3 year revenue & risk reward estimation. 
 
*Valuation is only personal opinion & view. Perception & forecast will change if any new quarter result release. Reader take their own risk & should do own homework to follow up every quarter result to adjust forecast of fundamental value of the company.

Saturday, March 20, 2021

Volcano Berhad

Copyright@http://lchipo.blogspot.com/
Follow us on facebook: https://www.facebook.com/LCH-Trading-Signal-103388431222067/

Open to apply: 16/03/2021
Close to apply: 24/03/2021
Listing date: 06/04/2021

Share Capital
Market Cap: RM57.75mil
Total Shares: 165mil shares, Esos 49.5mil (Public apply: 8.25mil, Company Insider/Miti/Private Placement/other: 51.75mil)

Industry
Volcano: 28.82%
Nameplate Competitor (GP margin)
Chiyoda Integrco.(M) Sdn Bhd: 28.52%
Flexi Components Sdn Bhd: 39.91%
Sanwa Screen (M) Sdn Bhd: 42.43%
Plastic injection moulded Competitor (GP Margin)
Saha-Union: 13.5%
Srithai Superware: 8.64%
SNC former: 10.39%

Business
Manufacturing of nameplates, Plastic injection moulded.
M'sia: 4.17%
S'pore: 43.98%
Thailand: 44.11%
others: 7.74%

Fundamental

1.Market: Ace Market
2.Price: RM0.35 (EPS:RM0.205)
3.P/E: PE17 (based on EPS 0.205, we not accept IPO prospecture using EPS 0.0232 to cal PE)
4.ROE(Pro Forma III): 3.78%
5.ROE: 4.19%(2020), 11.18%(2019), 12.38%(2018)
6.Cash & fixed deposit after IPO: RM0.12 per shares
7.NA after IPO: RM0.408
8.Total debt to current asset after IPO: 0.1567 (Debt: 7.032mil, Non-Current Asset: 29.544mil, Current asset: 44.86mil)
9.Dividend policy: PAT 30% dividend policy.

Past Financial Performance (Revenue, Earning Per shares)
2020: RM52.527 mil (EPS:0.0205)
2019: RM55.892 mil (EPS:0.0290)
2018: RM58.649 mil (EPS:0.0412)

Net Profit Margin
2020: 28.82%
2019: 30.65%
2018: 32.35%

After IPO Sharesholding
Datuk Ch'ng Huat Seng: 16.97% 
Gan Yew Thiam: 12.73%
Dato' Wong Tze Peng: 14.85%
Yeap Guan Seng: 6.36%
Khoo Boo Wui: 12.73%

Directors & Key Management Remuneration for FYE2021 (from gross profit 2020)
Total director remuneration: RM3.104 mil or 20.5%
key management remuneration: RM0.153mil - 0.3mil or 1.01%-1.98%
total (max): RM3.404mil or 22.48%  

Use of fund
Purchase of machineries & equipment: 63.43%
Listing Expenses: 36.57%

Good thing is:
1. Purchase of 6 unit laser cutting machines will increase 33.33% nameplate production. 
2. Purchase 5 unit of platic injection moulded will increase 15.56% capacity of production. 
2. Have 30% PAT dividend policy. 
3. Net profit is above 28% for past 3 years. 

The bad things:
1. PE17 is a bit expensive. 
2. For past 3 years, ROE is dropping. 
3. Revenue did not grow for past 3 years. 
4. Director remuneration is too expensive, 20.5% from the gross profit in 2020 pay for director remuneration. 
5. Listing expenses 36.57% from IPO fund is too expensive. 

Conclusions (Blogger is not wrote any recommendation & suggestion. All is personal opinion and reader should take their own risk in investment decision)
With the additional machineries will increase the capacity of the company. However the company still some risk like over past 3 year revenue did not grow. Please refer below chart to view the company Business expension potential & risk rating. 
*Valuation is only personal opinion & view. Perception & forecast will change if any new quarter result release. Reader take their own risk & should do own homework to follow up every quarter result to adjust forecast of fundamental value of the company.

Saturday, March 13, 2021

Flexidynamic Holdings Berhad

Copyright@http://lchipo.blogspot.com/
Follow us on facebook: https://www.facebook.com/LCH-Trading-Signal-103388431222067/

Open to apply: 09/03/2021
Close to apply: 16/03/2021
Listing date: 30/03/2021

Share Capital
Market Cap: RM56.778mil
Total Shares:  283mil shares (Public apply: 14.1 mil, Company Insider/Miti/Private Placement/other: 61.036mil)

Industry (Revenue)
Flexidynamic: RM31.31mil
Polydamic Group Bhd: RM11.78mil
Ripcol Industries S/B: RM17.2mil
Business
Design, engineering, installation, & commissioning of glove chlorination system.
M'sia: 86.28%
Vietnam: 4.38%
Thailand: 8.74%
Indonesia: 0.07%
Sri Lanka 0.53%

Fundamental
1.Market: Ace Market
2.Price: RM0.20 (EPS:RM0.0162)
3.P/E: PE12.35
4.ROE(Pro Forma III): 10.1%
5.ROE: 21.4%(2019), 24.8%(2018), 33%(2017)
6.Cash & fixed deposit after IPO: RM0.059 per shares
7.NA after IPO: RM0.12
8.Total debt to current asset after IPO: 0.708 (Debt: 31.832mil, Non-Current Asset: 21.998mil, Current asset: 44.976mil)
9.Dividend policy: Did not have formal dividend policy.

Past Financial Performance (Revenue, Earning Per shares)
2022: ***Remaining order book to be billed 2022 RM17.48mil
2021: ***order book to be billed Dec 2021 RM62.3mil
2020 (9mths): RM35.007 mil (EPS:0.0095)
2019: RM49.839 mil (EPS:0.0162)
2018: RM48.322 mil (EPS:0.0151)
2017: RM29.902 mil (EPS:0.0155) 

Net Profit Margin
2020 (9mths): 7.62%
2019: 9.22%
2018: 9.14%
2017: 14.79%

After IPO Sharesholding
Tan Kong Leong: 41.53%
Liew Heng Wei: 18.74%
Phitchaya Arsangku: 2.21%

Directors & Key Management Remuneration for FYE2021 (from gross profit 2019)
Total director remuneration: RM1.168mil or 8.37%
key management remuneration: RM0.4mil- 0.5mil or 2.87%-3.58%
total (max): RM1.668mil or 11.95%  

Use of fund
Repayment bank borrowing: 42.40% (purchase of 2 new factories 2019)
Renovation of new factories: 2.80%
Aquisition of machinery and equitment: 10.83%
Working capital: 24.03%
Listing Expenses: 19.94%

Good thing is:
1. Revenue increasing over 3 years. 
2. Debt ratio not too dangerous level. 
3. Two purchased new factories, estimated renovation completed by Aug-Sep 2021, 
4. Major customer Hartalega, contribute to Flexidyamic  revenue 2017-2020 (range 31.78%-40.91%).

The bad things:
1. Director fees & key managemnent remuneration already cost 11.95% from the company gross profit. 
2. Net profit percentage dropping since 2017.
3. No fixed dividend policy. 
4. ROE continue to fall over 3 years. 
5. Industry player for top 2 & top 3 revenue RM17mil & RM11mil, showing this industry is not generate high revenue (possible less demand of the project needed). 

Conclusions (Blogger is not wrote any recommendation & suggestion. All is personal opinion)
2020 is the high demand for glove, however did not see large improvement in net margin. The company secure RM62mil order book to be billed in 2021. We should see revenue able double at 2021 due to one off high demand order book due to the pandemic. After 2021, business revenue should back to normal phase. For business growth vs risk table please refer as below chart. 

*Valuation is only personal opinion & view. Perception & forecast will change if any new quarter result release. Reader take their own risk & should do own homework to follow up every quarter result to adjust forecast of fundamental value of the company.

Sunday, February 28, 2021

Teladan Setia Group Berhad


Copyright@http://lchipo.blogspot.com/
Follow us on facebook: https://www.facebook.com/LCH-Trading-Signal-103388431222067/

Open to apply: 23/02/2021
Close to apply: 02/03/2021
Listing date: 16/03/2021

Share Capital
Market Cap: RM386.543mil
Total Shares:  805.298 mil shares (Public apply: 40 mil, Company Insider/Miti/Private Placement/other: 161.595mil)

Industry (Net Profit %)
Property development

Business
Business mainly in Melaka
Residential: 51%
Mixed development: 49%

Fundamental
1.Market: Ace Market
2.Price: RM0.48 (EPS:RM0.054)
3.P/E: PE8.9
4.ROE(Pro Forma III): 10.36%
5.ROE: 12.60%(2019), 16.19%(2018), 22.27%(2017)
6.Cash & fixed deposit after IPO: RM0.1153 per shares
7.NA after IPO: RM0.54
8.Total debt to current asset after IPO: 0.56 (Debt: 214.877mil, Non-Current Asset: 266.719mil, Current asset: 381.972mil)
9.Dividend policy: 20% of PAT as dividend.

Past Financial Performance (Revenue, EPS)
2020 (9mths): RM100.028 mil (EPS:0.022)
2019: RM232.988 mil (EPS:0.054)
2018: RM259.141 mil (EPS:0.061)
2017: RM359.511 mil (EPS:0.078) 

Net Profit Margin
2020 (9mths):19.1%
2019: 18.6%
2018: 18.8%
2017: 17.49%

After IPO Sharesholding
Teo Lay Ban: 41.6%
Teo Lay Lee: 11.1%
Teo Siew May: 11.1%

Directors & Key Management Remuneration for FYE2021 (from gross profit 2019)
Total director remuneration: RM1.678 mil or 2.08%
key management remuneration: RM0.90 mil-1.05mil or 1.12%-1.30%
total (max): RM2.728mil or 3.38%  

Use of fund
Land acquisition: 45.3%
Working capital for project development: 42.8%
Repayment of bank borrowings: 5.2%
Listing Expenses: 6.7%

Good thing is:
1. IPO price fair with the company value, PE8.9.
2. Have profit margin of 17%-19% rannge. 
3. Directors & Key Management Remuneration is not too expensive. 

The bad things:
1. Property development industry is effected by current overall economic.
2. ROE is less than 15%

Conclusions (Blogger is not wrote any recommendation & suggestion. All is personal opinion)
Overall is fair valuation, but current economic situation is not encouraging property market to grow. Property market will need to wait at least more than 2 year to better demand. Invest in this IPO might need more time to wait and need to continue monitoring their performance. For business growth & business risk please refer to below chart. 

*Valuation is only personal opinion & view. Perception & forecast will change if any new quarter result release. Reader take their own risk & should do own homework to follow up every quarter result to adjust forecast of fundamental value of the company.

Saturday, February 6, 2021

Mobilia Holdings Berhad

Copyright@http://lchipo.blogspot.com/
Follow us on facebook: https://www.facebook.com/LCH-Trading-Signal-103388431222067/

Open to apply: 03/02/2021
Close to apply: 09/02/2021
Listing date: 23/01/2021

Share Capital
Market Cap: RM92mil
Total Shares:  400 mil shares (Public apply: 20mil, Company Insider/Miti/Private Placement/other: 80mil)

Industry (Net Profit %)
Homeriz: 15.18% 
Spring Art: 13.14%
Mobilia: 11.14%
Liihen: 9.51%

Business
Design & Manufacturing of home furniture.
Oversea: 73.39%
Malaysia: 26.61%
*2017-2020: 50.48%-56.48% revenue come from 5 major customer. 

Fundamental
1.Market: Ace Market
2.Price: RM0.23 (EPS:0.02)
3.P/E: PE11.50
4.ROE(Pro Forma III): 17.29%
5.ROE: 35.71%(2019), 27.55%(2018), 31.45%(2017)
6.Cash & fixed deposit after IPO: RM0.0406 per shares
7.NA after IPO: RM0.10
8.Total debt to current asset after IPO: 1.176 (Debt: 39.385mil, Non-Current Asset: 45.954mil, Current asset: 33.447mil)
9.Dividend policy: No fixed dividend policy.

Past Financial Performance (Revenue, EPS)
2020 (8mths): RM44.729 mil (EPS:0.0136)
2019: RM75.589 mil (EPS:0.0248)
2018: RM66.504 mil (EPS:0.0184 )
2017: RM55.730 mil (EPS:0.0184) 

Net Profit Margin

2020 (8mths): 10.31%
2019: 11.14%
2018: 9.39%
2017: 11.24%

After IPO Sharesholding
Quek Wee Seng: 74.56% (Exelient & Firstchrome)
Quek Wee Seong: 73.88% (Exelient & Firstchrome)

Directors Remuneration for FYE2021 (from gross profit 2019)
Datin Siah Li Mei: RM42k
Quek Wee Seng: RM577k
Quek Wee Seong: RM474k
Tajul Arifin: RM42k
Lim See Tow: RM42k
Total director remuneration: RM1.177 mil or 6.05%

Key Management Remuneration  for FYE2021 (from gross profit 2019)
Tan Ley Wun: RM150k-200k
Khoo Ai Lee: RM150k-200k
Ku Yong Yee: RM100k-150k
Wong Eng Chuan: RM200k-250k
Quek Yan Song: RM50k-100k
key management remuneration: RM0.65mil-0.9mil or 3.34-4.62%

Use of fund
Construction of building: 42.03%
Purchase of machineries: 9.42%
Repayment of borrowings: 13.77%
Working capital: 13.77%
Listing Expenses: 21.74%

Good thing is:
1. PE11.5 is acceptable fair value.
2. ROE above 15%.
3. Revneue continue increase over past 3 years.
4. Global work from home trend increase demand of furniture.

The bad things:
1. Top 5 major customer contribute over 50% of company revenue. 
2. Debt is high. 
3. Director & top management remuneration is over 10% from company gross profit. 
4. Use 13.77% IPO fund to pay debt, & listing expenses is 21.74% of total IPO fund (this 2 item is less help to contribute business growth in futures)

Conclusions (Blogger is not wrote any recommendation & suggestion. All is personal opinion)
The company choosen the right timing to IPO as global work from home increase demand of furniture, however Mobilia furniture is more focus on wood based furniture. The exstimated completion time for factory block B & C is 2022, we should see more revenue come in after 2 years time (unable to find out how many % increase in production capacity). Please refer below chart to understand the risk vs business growth forecast for the company within 3 years.

*Valuation is only personal opinion & view. Perception & forecast will change if any new quarter result release. Reader take their own risk & should do own homework to follow up every quarter result to adjust forecast of fundamental value of the company.