Tuesday, October 24, 2023

PLYTEC HOLDING BERHAD

Copyright@http://lchipo.blogspot.com/
Follow us on facebook: https://www.facebook.com/LCH-Trading-Signal-103388431222067/

***Important***Blogger is not wrote any recommendation & suggestion. All is personal
opinion and reader should take their own risk in investment decision
Open to apply: 24 Oct 2023
Close to apply: 31 Oct 2023
Balloting: 02 Nov 2023
Listing date: 15 Nov 2023

Share Capital
Market cap: RM212.121 mil
Total Shares: 606.0606 mil shares

Industry CARG
Local Contractors in the Malaysian Construction Industry as at 26 December 2023 (G7 grade): 9.516
Industry competitors comparison (net profit%)
Plytec: 8.69%
Peri Formwork Malaysia Sdn Bhd: 13.07%
BIMTECH Solutions Sdn Bhd: 14.21%
Doka Formwork Malaysia Sdn Bhd: 12.09%
Engtex Sdn Berhad: 6.97%
Others: -63.80% to 9.73%

Business (FPE 2023)
Construction engineering solutions and services as well as trading and distribution of building materials.
Business Segment
CME solution: 33.78%
Trading and distribution of building materials: 59.96%
DDE Solution: 4.54%
PC solution: 1.72%

Fundamental
1.Market: Ace Market
2.Price: RM0.35
3.P/E: RM15.49
4.ROE(FPE2023): 5.48%   
5.ROE: 16.38%(FYE2022), 14.97%(FYE2021), 11.66%(FYE2020), 14.56%(FYE2019)
6.Net asset: RM0.15
7.Total debt to current asset: 0.890  (Debt: 105.318mil, Non-Current Asset: 106.837mil, Current asset: 118.304mil)
8.Dividend policy: no formal dividend policy.
9. Shariah status: -

Past Financial Performance (Revenue, Earning Per shares, PAT%)
2023 (FPE 31May, 5mth): RM62.581 mil (Eps: 0.0046), PAT: 4.54%
2022 (FYE 31Dec): RM158.091 mil (Eps: 0.0226), PAT: 8.69%
2021 (FYE 31Dec): RM112.712 mil (Eps: 0.0178), PAT: 9.62%
2020 (FYE 31Dec): RM113.792 mil (Eps: 0.0181), PAT: 6.30%
2019 (FYE 31Dec): RM190.111 mil (Eps: 0.0131), PAT: 4.16%

Major customer (FPE2023)
1.Siab Group of companies: 14.33%
2.Orangebeam Construction Sdn. Bhd: 9.10%
3.Eng Han Enginnering Sdn Bhd: 8.19%
4.Nestcon Builders Sdn Bhd.: 6.46%
5.Alphazen Contract Sdn Bhd: 4.02%
***total 42.10%

Major Sharesholders
1.Resilient Capital Holdings: 41.37% (direct)
2.Prestij Usaha: 32.63% (direct)
3.Yang Kian Lock: 74% (Indirect)

Directors & Key Management Remuneration for FYE2023
(from Revenue & other income 2022)
Total director remuneration: RM2.321 mil
key management remuneration: RM2.205 mil – RM2.250 mil
total (max): RM4.481 mil or 10.59%

Use of funds
1.Capital expenditure: 21.55%
2.Repayment of borrowings: 24.24%
3.Construction of factories and centralised labour quarters on the Olak Lempit Land: 21.01%
4.Purchase of software systems and hardware: 5.39%
5.Working capital: 17.03%
6.Estimated listing expenses: 10.78%

Conclusions (Blogger is not wrote any recommendation & suggestion. All is personal opinion and reader should take their own risk in investment decision)
Overall is high risk industry in current situation.

*Valuation is only personal opinion & view. Perception & forecast will change if any new quarter result release. Reader take their own risk & should do own homework to follow up every quarter result to adjust forecast of fundamental value of the company.

Wednesday, October 11, 2023

Invest group 3: Open registration

Invest Group 3 open for registration (max 30 member)
Fees:  RM369.00 (membership year 2024)
Note: we never auto contract any member, if you interested you have to self PM us. 
Phone: 0132820766 (other than this number all is SCAM). 
Disclaimer: All the info in the membership group is only sharing opinion. All member have to do their own study & take their own risk. 

Warning!!! 
We never send message /provide training class/ call member for any recommendations signal. If you received any massage / call / registration using our page name is SCAM!!!


Below is our invest group 2 example picture. 


Wednesday, September 20, 2023

MINOX INTERNATIONAL GROUP BERHAD

Copyright@http://lchipo.blogspot.com/
Follow us on facebook: https://www.facebook.com/LCH-Trading-Signal-103388431222067/

***Important***Blogger is not wrote any recommendation & suggestion. All is personal
opinion and reader should take their own risk in investment decision.
Open to apply: 20 Sep 2023
Close to apply: 03 Oct 2023
Balloting: 06 Oct 2023
Listing date: 17 Oct 2023

Share Capital
Market cap: RM90 mil
Total Shares: 360 mil shares

Industry CARG (2023f-2027f)
Historical & Growth Forecast for the Sanitary Valves and Fittings Industry in Malaysia: 11.2%
Industry competitors comparison (net profit%)
Minox: 22.9%
PME: 26.2%
SRM: 12.6%
Others: 0.00% to 10.7% 

Business (FPE 2023)
Distribution of stainless steel sanitary valves, tubes & fittings, installation components & equipment, rubber hoses under our “MINOX®” brand and other related products.
Revenue by Geo
Malaysia: 27%
Indonesia: 34.6%
Singapore: 25.9%
Thailand: 7.8%
Others: 4.7%

Fundamental
1.Market: Ace Market
2.Price: RM0.25
3.Forecast P/E: 10.68 (EPS 0.0234)
4.ROE(Pro Forma III):  14.33%
5.ROE: 20.85%(FYE2022), 19.89%(FYE2021), 10.25%(FYE2020), 23.20%(FYE2019)
6.Net asset: 0.06
7.Total debt to current asset: 0.55 (Debt: 35.530mil, Non-Current Asset: 43.262mil, Current asset: 64.154mil)
8.Dividend policy: No formal dividend policy.
9. Shariah status: Yes.

Past Financial Performance (Revenue, Earning Per shares, PAT%)
2023 (FPE 30Apr, 4mths): RM16.429 mil (Eps: 0.005), PAT:11.3%
2022 (FYE 31Oct): RM45.020 mil (Eps: 0.029), PAT: 22.9%
2021 (FYE 31Oct): RM34.359 mil (Eps: 0.022),PAT: 23.0%
2020 (FYE 31Oct): RM38.804 mil (Eps: 0.010),PAT: 9.20%
2019 (FYE 31Oct): RM40.195 mil (Eps: 0.021),PAT: 18.7%

Major customer (FPE2023)
1. Tetra Pak Group: 17.8%
2. SiccaDania (SEA) Pte Ltd: 14%
3. GEA Group: 7.1%
4. PL Plus M&E Sdn Bhd: 3.3%
5. MST VN: 2.6%
***total 44.8%

Major Sharesholders
1. Cheong Chee Soon: 51.4% (direct)
2. Looi Poo Poo: 10.4% (direct)
3. Gamal Abdul Nashir: 4.9% (direct)

Directors & Key Management Remuneration for FYE2023
(from Revenue & other income 2022)
Total director remuneration: RM2.574 mil
key management remuneration: RM1.75 mil – RM2.0 mil
total (max): RM4.574 mil or 17.2%

Use of funds
1. Product development and deployment: 17.8%
2. Construction of Warehouse 4:  17.8%
3. Setting up a new warehouse in Singapore: 22.3%
4. Repayment of bank borrowings:  20%
5. General working capital: 7%
6. Estimated listing expenses: 15.1%

Conclusions (Blogger is not wrote any recommendation & suggestion. All is personal opinion and reader should take their own risk in investment decision)

Overall is a more to conventional business. The grow of business also more to conventional phase.

*Valuation is only personal opinion & view. Perception & forecast will change if any new quarter result release. Reader take their own risk & should do own homework to follow up every quarter result to adjust forecast of fundamental value of the company.

Friday, September 8, 2023

SSF HOME GROUP BERHAD

Copyright@http://lchipo.blogspot.com/

Follow us on facebook: https://www.facebook.com/LCH-Trading-Signal-103388431222067/

***Important***Blogger is not wrote any recommendation & suggestion. All is personal
opinion and reader should take their own risk in investment decision.
Open to apply: 08 Sep 2023
Close to apply: 27 Sep 2023
Balloting: 03 Oct 2023
Listing date: 12 Oct 2023

Share Capital 
Market cap: RM200 mil
Total Shares: 800 mil shares

Industry CARG
Estimated Market Size and Growth Forecast for the Home Furnishing Retail Industry in Malaysia
Compound annual growth rate (“CAGR”) (2023-2027) (base year of 2022): 9.3%
Industry competitors comparison (net profit%)
1. SHG: 9.2%
2. Syarikat Yoong Onn Sdn Bhd: 11.4%
3. Courts (Malaysia) Sdn Bhd: 10.3%
4. Eastern Decorator Sdn Bhd: 8.6%
5. Others: -97.2% to 8%

Business (FYE 2023) 
Involved in the retail of furniture, home décor and home living products via our retail channel (retail outlets) and online channel (ecommerce website).
Product Segments
Furniture: 53.5%
Home Décor: 21.80%
Home Living: 20.1%
Others: 4.6%

Fundamental
1.Market: Ace Market
2.Price: RM0.25
3.Forecast P/E: 12.5 (FYE2023 EPS: RM0.020)
4.ROE(Pro Forma III): 10.10%
5.ROE: 17.16%(FPE2022), 30.95%(FYE2021), 5.92%(FYE2020)
6.Net asset: RM0.05
7.Total debt to current asset: 0.205 (Debt: 30.625mil, Non-Current Asset: 39.535mil, Current asset: 149.307mil)
8.Dividend policy: No formal dividend policy.
9. Shariah status: Yes

Past Financial Performance (Revenue, Earning Per shares, PAT%) 
2023 (FYE 30Apr): RM174.474 mil (Eps: 0.020), PAT: 9.2%
2022 (FYE 30Apr): RM160.990 mil (Eps: 0.021), PAT: 10.4%
2021 (FYE 30Apr): RM208.073 mil (Eps: 0.039), PAT: 15%
2020 (FYE 30Apr) RM129.381 mil (Eps: 0.005), PAT: 3.2%

Major customer
Business model primarily is walk-in customers. Did not depend on major customer. 

Major Sharesholders 
1. Wong Choong Loong: 48.3% (Direct)
2. Lok Kok Khong: 15% (Direct)
3. Chin See Kew: 4.4% (Direct)
4. Wong Choong Lian: 4.3% (Direct)

Directors & Key Management Remuneration for FYE2024 
(from Revenue & other income 2023)

Total director remuneration: RM3.140 mil
key management remuneration: RM0.90 mil – RM1.00 mil
total (max): RM4.140 mil or 4.35%

Use of funds
1. Set-up new retail outlets (capital expenditure): 28.5%
2. Set-up new retail outlets (Start-up costs): 41.9%
3. Repayment of bank borrowings: 10%
4. Marketing activities: 3%
5. General working capital: 8%
6. Estimated listing expenses: 8.6%
Conclusions (Blogger is not wrote any recommendation & suggestion. All is personal opinion and reader should take their own risk in investment decision)
Consider a normal IPO. Did not have see much advantage or special difference compare to other competitors. 
 
*Valuation is only personal opinion & view. Perception & forecast will change if any new quarter result release. Reader take their own risk & should do own homework to follow up every quarter result to adjust forecast of fundamental value of the company.

Tuesday, August 29, 2023

EVERGREEN MAX CASH CAPITAL BERHAD

Copyright@http://lchipo.blogspot.com/
Follow us on facebook: https://www.facebook.com/LCH-Trading-Signal-103388431222067/

***Important***Blogger is not wrote any recommendation & suggestion. All is personal
opinion and reader should take their own risk in investment decision.

Open to apply: 29 August 2023
Close to apply: 12 September 2023
Balloting: 15 September 2023
Listing date: 26 September 2023

Share Capital
Market cap: RM267.5766 mil
Total Shares: 1.1149 bil shares

Industry CARG
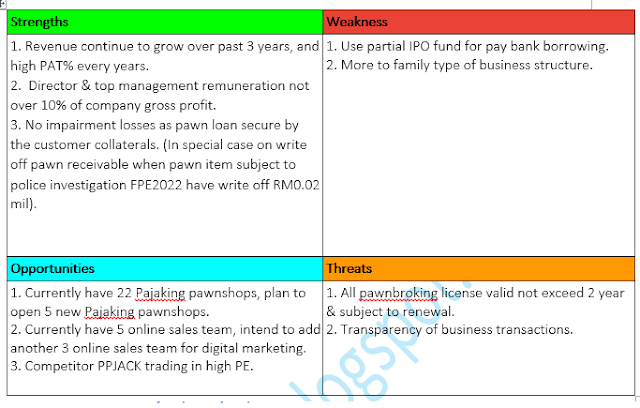
Pawnbroking industry size in Malaysia CAGR (2017-2022): 5.2%
Industry competitors comparison (net profit%)
1. EMCC group: 30.56% (PE13.3)
2. PPjack: 14.46% (PE49)
3. Others (Sdn Bhd): -5.8% to 56.36%

Business (FYE 2023)
1. Pawnbroking services (Revenue: 30.3%)
- Monthly interest based on pawn loan.
- Administrative fee
2. Gold and luxury product retail and trading (Revenue: 69.2%)
- One-off sales.
3. Pawnbroking consultancy and IT solutions. (Revenue: 0.5%)
- Monthly consultation fee.
- Monthly IT solutions fee. 

Fundamental
1.Market: Ace Market
2.Price: RM0.24
3.Forecast P/E: 13.3 (FYE2022, EPS RM0.018)
4.ROE(FPE2023):  11.12%
5.ROE: 5.1%(FPE2022), 11.06%(FYE2021), 8.3%(FYE2020),1.17%(FYE2019)
6.Net asset: RM0.17
7.Total debt to current asset: 0.394  (Debt: 69.246mil, Non-Current Asset: 26.428mil, Current asset: 175.866mil)
8.Dividend policy: 20% PAT dividend policy.
9. Shariah status: -

Past Financial Performance (Revenue, Earning Per shares, PAT%)
2023 (FPE 30 Apr, 4mth): RM35.956 (Eps: 0.004), PAT: 13.7%
2022 (FYE 31Dec): RM67.173 mil (Eps: 0.0180), PAT: 29.8%
2021 (FYE 31Dec): RM60.903 mil (Eps: 0.0110),PAT: 19.6%
2020 (FYE 31Dec): RM24.426 mil (Eps: 0.0060),PAT: 25.9%
2019 (FYE 31Dec): RM14.802 mil (Eps: 0.0010),PAT: 5.4%

Major customer (2023)
1. Nexigold Jewellery Sdn Bhd: 22.6%
2. Gold Bullion Precious Metal Sdn Bhd: 33.3%
***total 55.9%

Major Sharesholders
1. Tirai Anggerik: 55.6% (direct)
2. Dato’ Low Kok Chuan : 55.6% (Indirect)
3. Datin Tea Guat Ngo : 55.6% (Indirect)
4. Low Kok Hu: 55.6% (indirect)
5. Tee Kian Heng: 3.3% (indirect)

Directors & Key Management Remuneration for FYE2023
(from Revenue & other income 2022)
Total director remuneration: RM0.969 mil
key management remuneration: RM0.50 mil – RM0.65 mil
total (max): RM1.619 mil or 6.91%

Use of funds
1. Expansion of pawnshops: 31.1%
2. Cash capital for our pawnbroking business: 46.7%
3. Repayment of bank borrowings: 6.2%
4. Working capital: 8%
5. Estimated listing expenses: 7.2%

Conclusions (Blogger is not wrote any recommendation & suggestion. All is personal opinion and reader should take their own risk in investment decision)
Overall is high risk investment, and also come with high grow return opportunities. 

*Valuation is only personal opinion & view. Perception & forecast will change if any new quarter result release. Reader take their own risk & should do own homework to follow up every quarter result to adjust forecast of fundamental value of the company.

Monday, August 28, 2023

MERCURY SECURITIES GROUP BERHAD

Copyright@http://lchipo.blogspot.com/
Follow us on facebook: https://www.facebook.com/LCH-Trading-Signal-103388431222067/

***Important***Blogger is not wrote any recommendation & suggestion. All is personal
opinion and reader should take their own risk in investment decision.

Open to apply: 28 August 2023 
Close to apply: 05 September 2023
Balloting: 08 September 2023
Listing date: 19 September 2023

Share Capital
Market cap: RM223.250 mil
Total Shares: 893 mil shares

Industry CARG
1. Total trading value (2018-2022) : -4.0%
2. Total trading volume (2018-2022): 3.2%
3. Fund raised via equity fundraising (2018-2022):  29.80%
Industry competitors comparison (net profit%)
Mercury Group: 40.7%
M & A Securities S/B: 37.0%
Inter-Pacific Securities S/B: 32.3%
UOB Kay Hian Securities (M) S/B: 27.80%
Others:  -39% to 24.6%

Business (FYE 2023)
Investment holding company and through our Subsidiaries, we are principally engaged in the stockbroking, corporate finance advisory and other related businesses as well as provision of nominee and custodian services.
Segment
1. Stockbroking Segment: 79.47%
2. Corporate Finance Segment: 20.53%
3. Related Activities

Fundamental
1.Market: Ace Market
2.Price: RM0.25
3.Forecast P/E: 16.88 (forecast, EPS 0.01481, didn’t use PE in prospectuses book)
4.ROE(Pro Forma III): 3.12%
5.ROE: 14.01%(FPE2022), 19.57%(FYE2021), 14.75%(FYE2020), 6.96%(FYE2019)
6.Net asset: RM0.182
7.Total debt to current asset: 0.099 (Debt: 15.045mil, Non-Current Asset: 25.603mil, Current asset: 151.939mil)
8.Dividend policy: No formal dividend policy.
9. Shariah status: -

Past Financial Performance (Revenue, Earning Per shares, PAT%)
2023 (FPE 30Apr, 6 mths): RM11.439 mil (Eps: 0.0057), PAT: 44.38%
2022 (FYE 31Oct): RM31.333 mil (Eps: 0.01822), PAT: 69.59%
2021 (FYE 31Oct): RM40.169 mil (Eps: 0.01355),PAT: 47.16%
2020 (FYE 31Oct): RM36.303 mil (Eps: 0.01366),PAT: 50.44%
2019 (FYE 31Oct): RM22.211 mil (Eps: 0.00695),PAT: 43.92%

Major customer (2023) 
1. Ace Credit (M) Sdn Bhd: 5.61%
2. Public Mutual Berhad: 4.49%
3. Individual: 3.85%
4. Evergreen Max Cash Capital Berhad: 2.89%
5. Pembinaan Azam Jaya Sdn Bhd: 2.88% 
***total 19.72%

Major Sharesholders
1. Chew Sing Guan: 37.08% (direct)
2. Enrogetz: 29.08% (direct)
3. Dato’ A. Rahman Bin Safar: 8.24% (direct)
4. Faizal Bin Mat Zuki: 29.08% (indirect)

Directors & Key Management Remuneration for FYE2023
(from Revenue & other income 2022)

Total director remuneration: RM0.465 mil
key management remuneration: RM1.35 mil – RM1.65 mil
total (max): RM2.115 mil or 9.7%

Use of funds
1. Margin financing facility services: 68.39%
2. Digitalisation programme and marketing activities: 7.33%
3. Working capital: 11.80%
4. Estimated listing expenses: 12.48%
Conclusions (Blogger is not wrote any recommendation & suggestion. All is personal opinion and reader should take their own risk in investment decision)
Overall is a profitable business model, but might not suitable for long term holding. 
 
*Valuation is only personal opinion & view. Perception & forecast will change if any new quarter result release. Reader take their own risk & should do own homework to follow up every quarter result to adjust forecast of fundamental value of the company.
x

Thursday, July 27, 2023

GLOSTREXT BERHAD

Copyright@http://lchipo.blogspot.com/
Follow us on facebook: https://www.facebook.com/LCH-Trading-Signal-103388431222067/

***Important***Blogger is not wrote any recommendation & suggestion. All is personal
opinion and reader should take their own risk in investment decision.


Open to apply: 27 July 2023
Close to apply: 02 Aug 2023
Balloting: 4 Aug 2023
Listing date: 15 Aug 2023

Share Capital
Market cap: RM77.33779 mil
Total Shares: 407.041 mil shares

Industry CARG
The geotechnical instrumentation and testing industry size (Singapore), 2017 – 2021: 5.76%
The geotechnical instrumentation and testing industry size (Malaysia), 2017 – 2021: -ve%
Industry competitors comparison (PAT%)
Glostrext Group: 19.04% (FYE2023) 
Ryobi Geotechnique International Pte Ltd: 20.01%
Element Geotechnical Testing (S) Pte Ltd: 24.77%
Aps Asia Pda Enterprise Pte Ltd: 19.04%
Others: -4.67% to 17.9%

Business (FYE 2023) 
Geotechnical instrumentation service provider. 
- customer type: Piling companies & construction companies. 
1. Pile instrumentation and static load test: 80.9%
2. Structural and ground instrumentation and monitoring services: 17.23%
3. Others: 1.87%
Revenue by Geo (FYE2023)
1. Singapore: 64.33%
2. Malaysia: 35.01%
3. Cambodia: 0.66%

Fundamental
1.Market: Ace Market
2.Price: RM0.19
3.Forecast P/E: 22.35 @ EPS0.0085 (adjusted EPS) 
4.ROE(Pro Forma II): 9.8% 
5.ROE: 11.68%(FYE2023), 24.36%(FYE2022), 9.45%(FYE2021), 18.64%(FYE2020)
6.Net asset: RM0.13
7.Total debt to current asset IPO: 0.227 (Debt: 7.866mil, Non-Current Asset: 25.233mil, Current asset: 34.654mil)
8.Dividend policy: no formal dividend policy.
9. Shariah status: -

Past Financial Performance (Revenue, Earning Per shares, PAT%)
2023 (FYE 31Mar): RM21.616 mil (Eps: 0.0101),PAT: 19.04% 
2022 (FYE 31Mar): RM26.574 mil (Eps: 0.0166),PAT: 27.61%
2021 (FYE 31Mar): RM16.966 mil (Eps: 0.0055),PAT: 14.12%
2020 (FYE 31Mar): RM23.963 mil (Eps: 0.0100),PAT: 18.47%

Order Book/Contract
Currently have: RM8.935mil

Operating cashflow vs PBT
2023: 15.41%
2022: 114%
2021: 113%
2020: 98.68%

Major customer (FYE 2023)

1. Asia Piling Co Pte Ltd: 13.83%
2. TPW Engineering Pte Ltd: 11.11%
3. CS Bored Pile System Pte Ltd: 8.79%
4. Econpile (M) Sdn Bhd: 7.11%
5. Aneka Jaringan Sdn Bhd: 4.89%
***total 45.73%

Major Sharesholders
Ir Dr Lee Sieng Kai: 45.63% (direct)
Tan Ah Huat: 18.41% (direct)

Directors & Key Management Remuneration for FYE2023
(from Revenue & other income 2023)

Total director remuneration: RM1.127mil
key management remuneration: RM1.40 mil – RM1.550 mil
total (max): RM2.677 mil or 23.91%

Use of funds 
1. Business expansion and working capital: 58.23%
2. Research and development: 8.95%
3. Repayment of bank borrowings: 16.41%
4. Estimated listing expenses: 16.41%
Conclusions (Blogger is not wrote any recommendation & suggestion. All is personal opinion and reader should take their own risk in investment decision)
Overall is still low grow industry. 

*Valuation is only personal opinion & view. Perception & forecast will change if any new quarter result release. Reader take their own risk & should do own homework to follow up every quarter result to adjust forecast of fundamental value of the company.